In-Season Monitoring
The In-Season Monitoring feature is designed for Corteva seed sales reps who need to monitor crop conditions in real-time.
Go to ca.app.granular.ag
1. Introduction
In-Season Monitoring integrates critical data like local weather, planting data, and field notes. This helps you avoid combine surprises and provides deeper field analysis for grower conversations, highlighting potential yield-limiting factors so you can proactively address them.
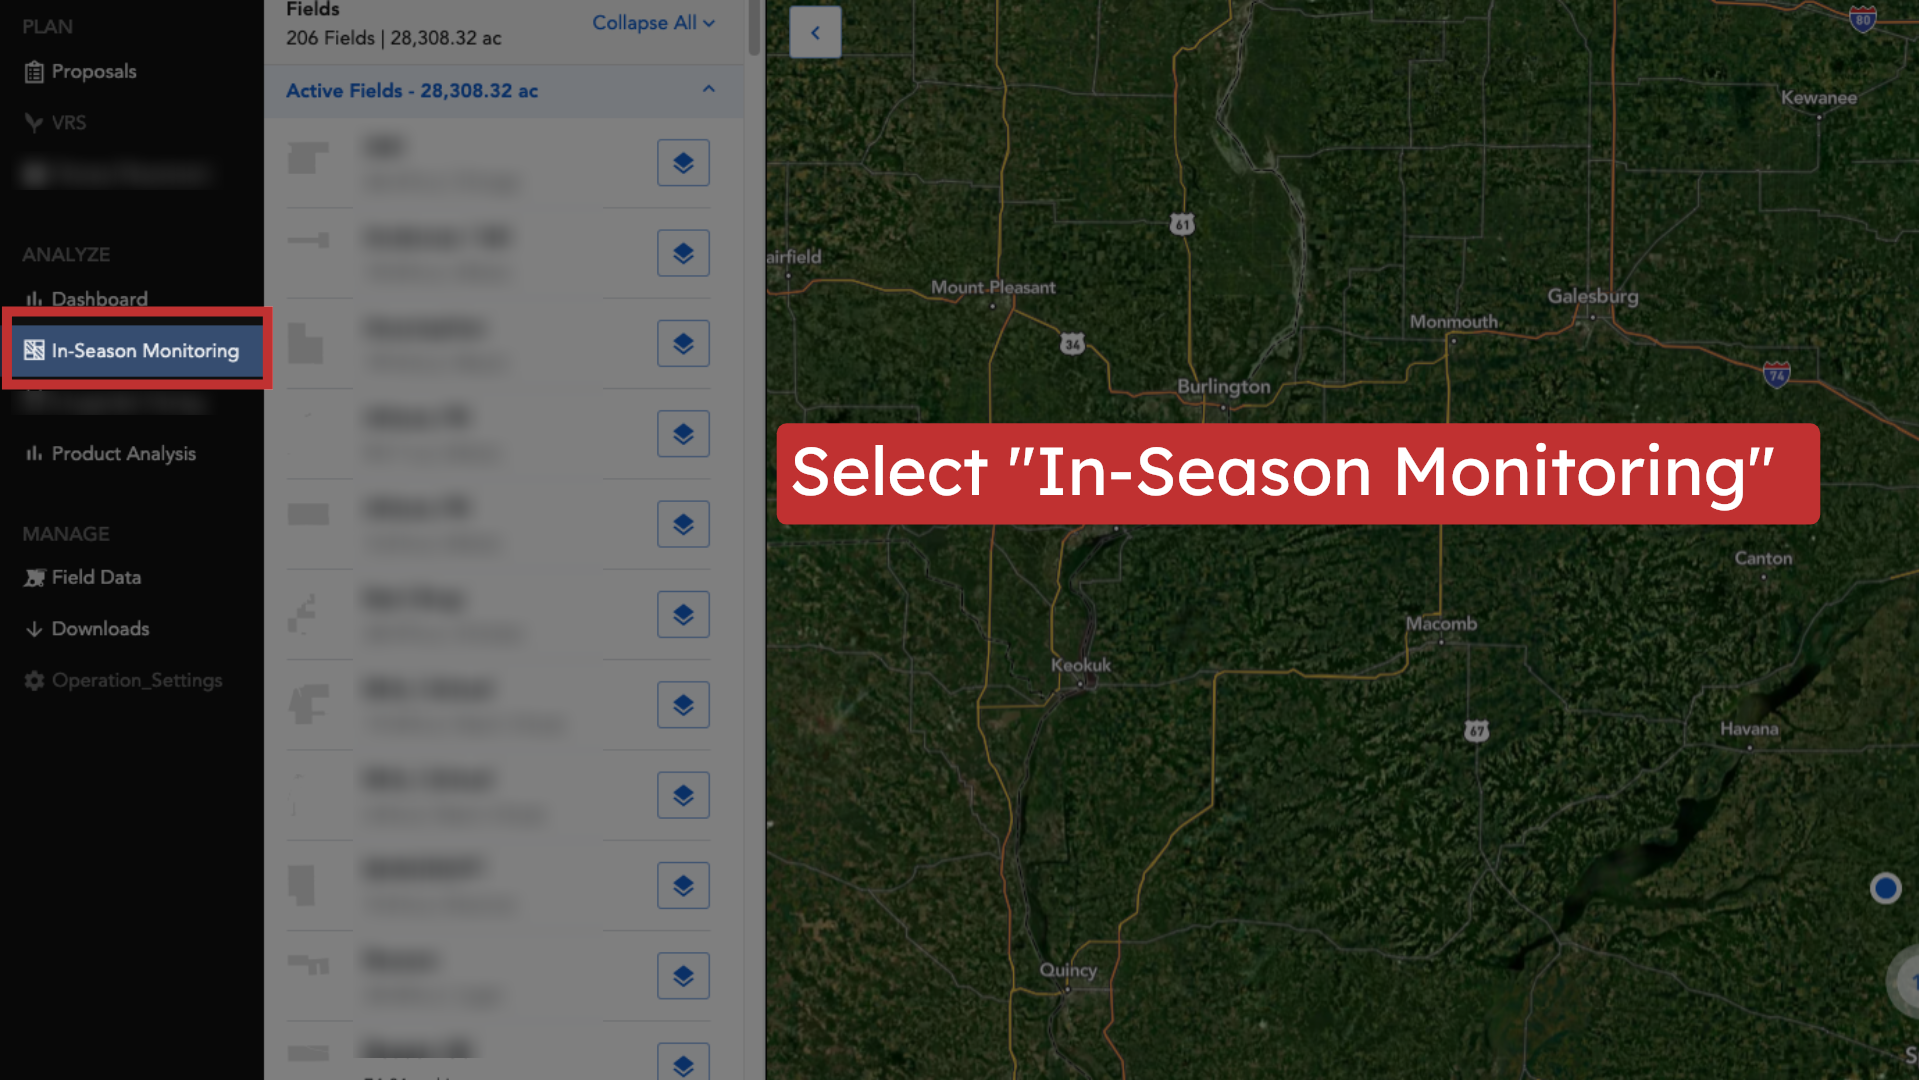
2. Select "In-Season Monitoring"
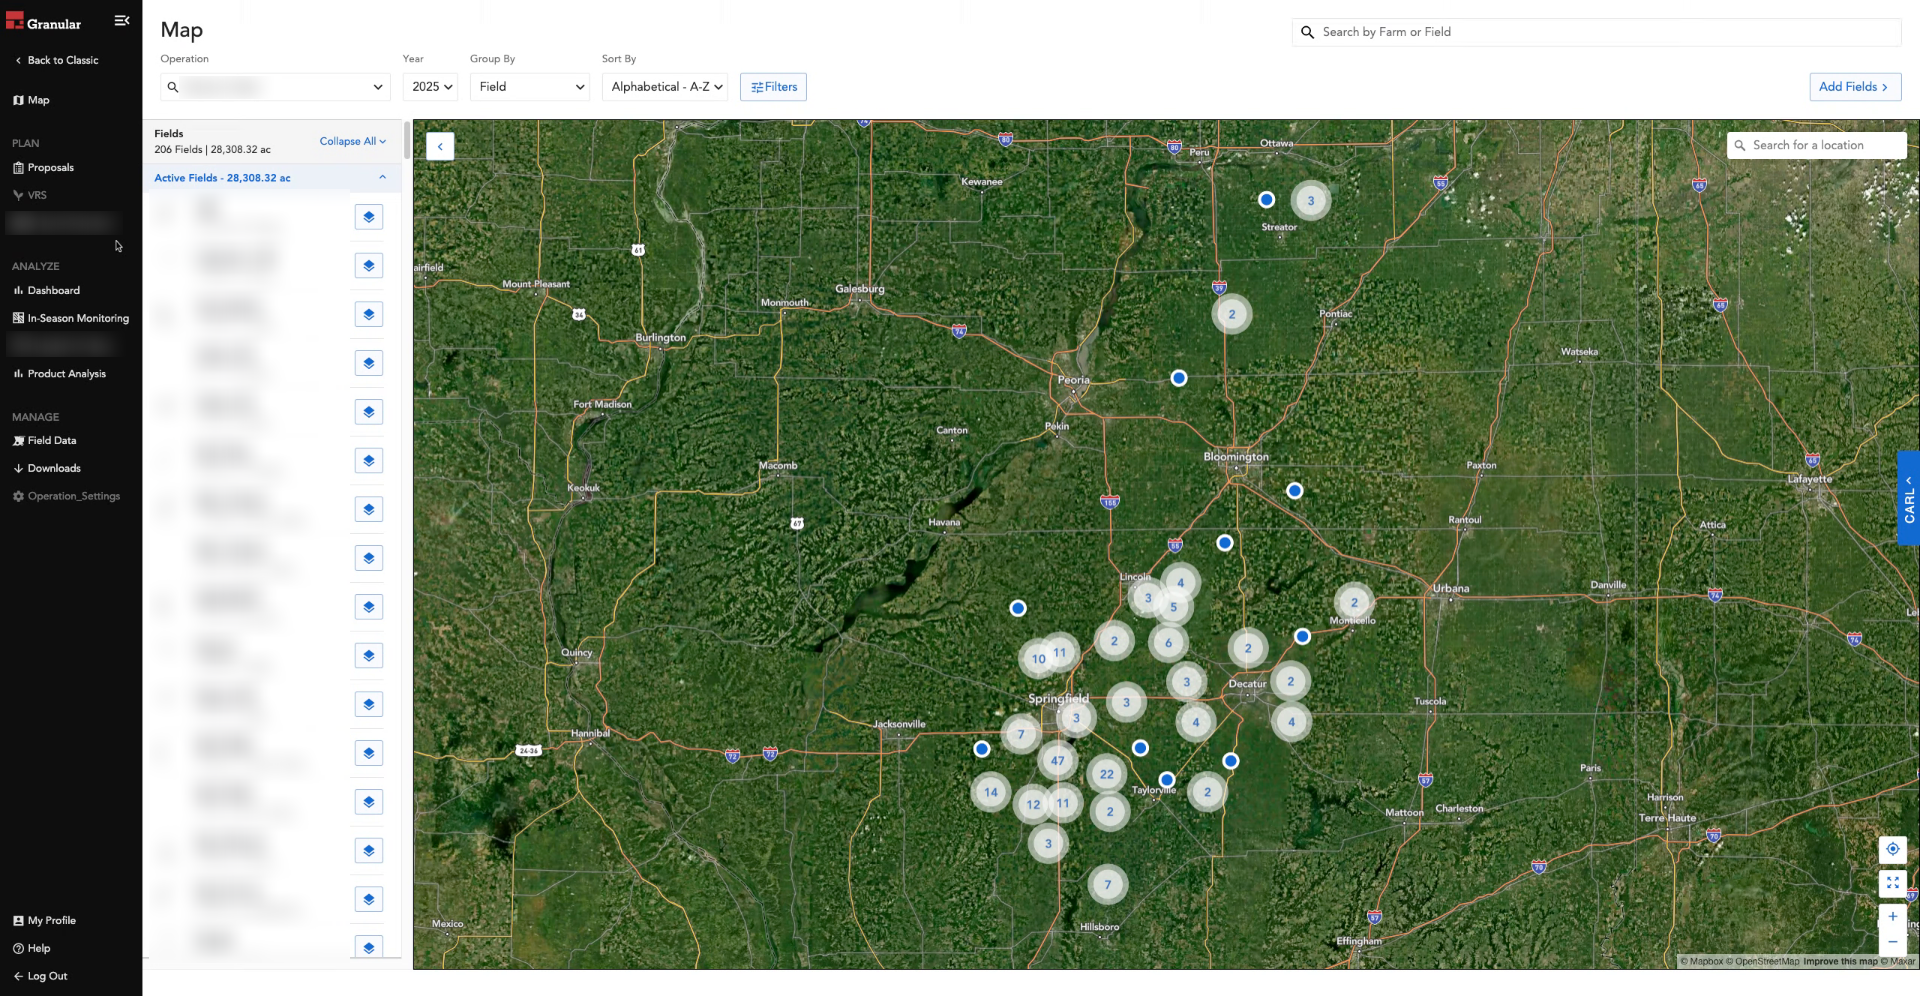
Access the In-Season Monitoring feature from the Granular Insights platform to begin leveraging its powerful data integration for your fields.
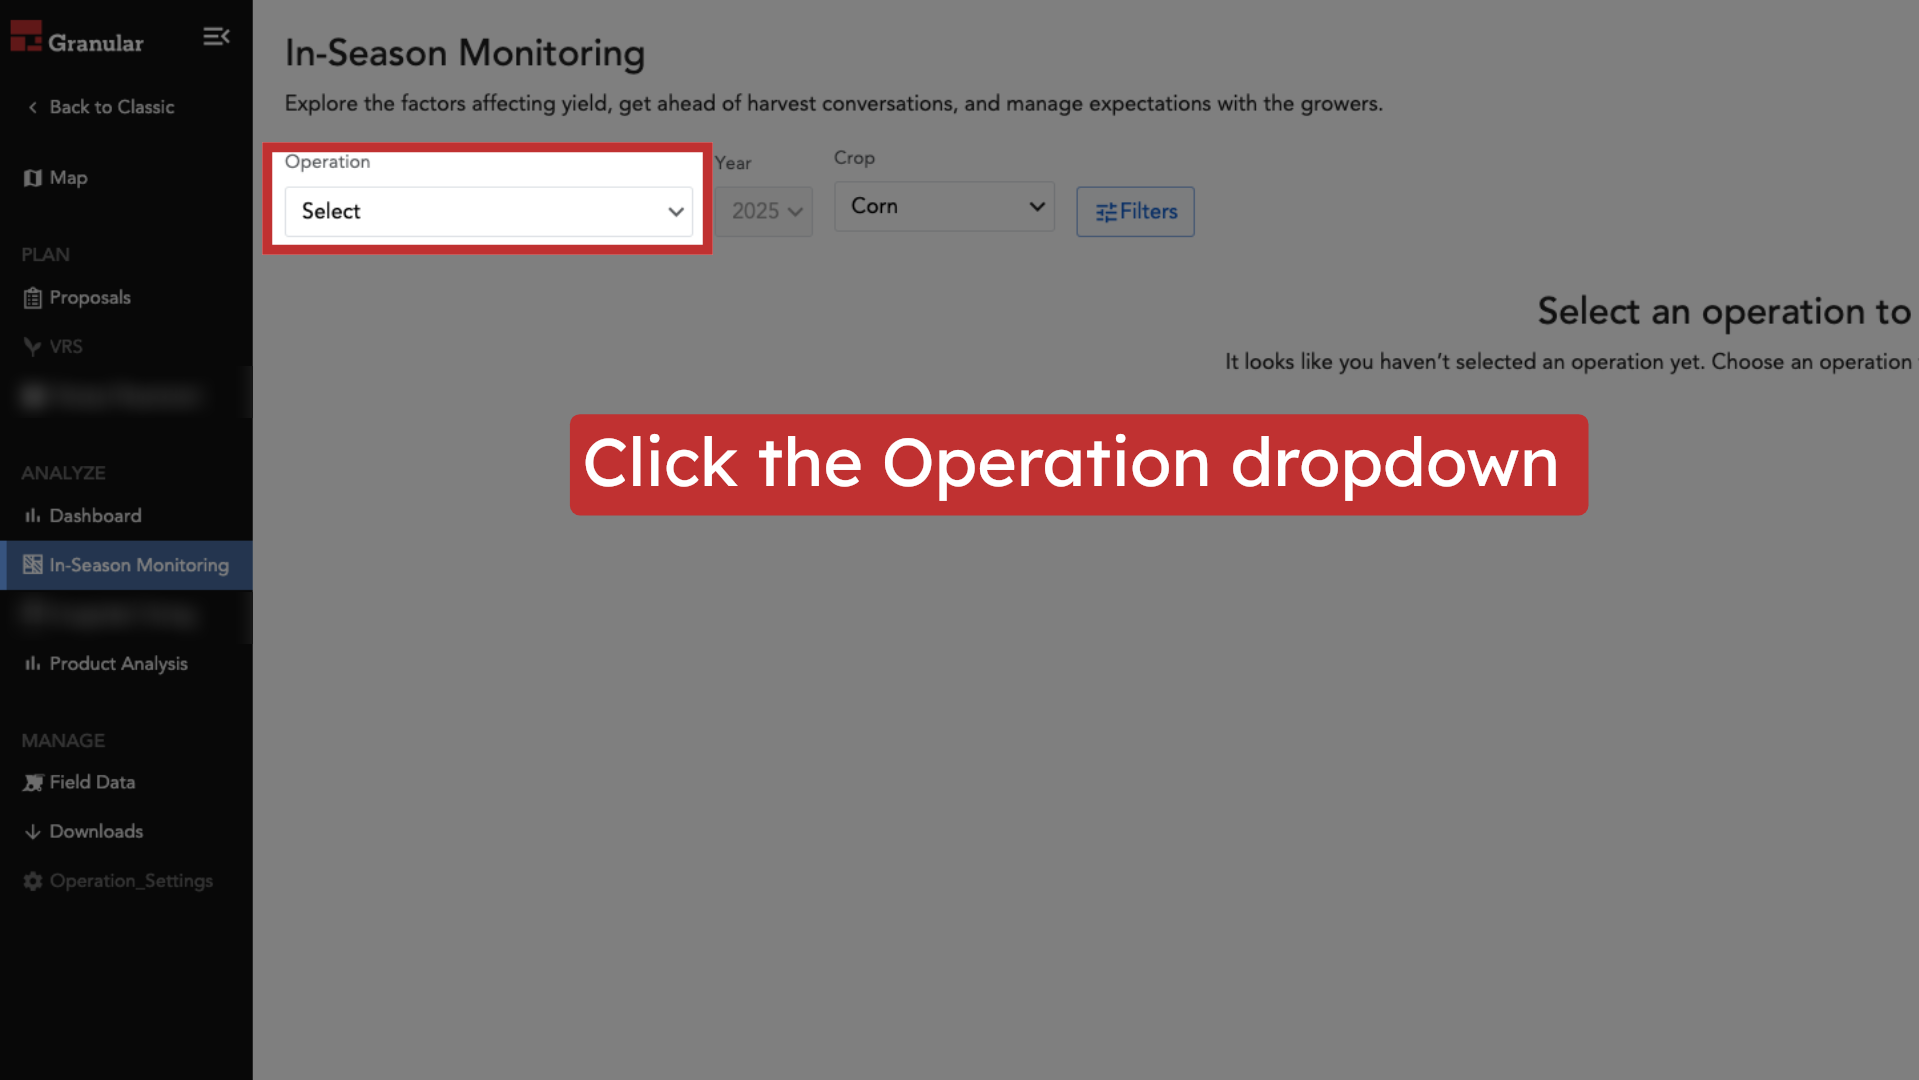
3. Click the Operation dropdown
The Operation menu allows you to select one or more operations, giving you a view across operations at the scale of your agency.
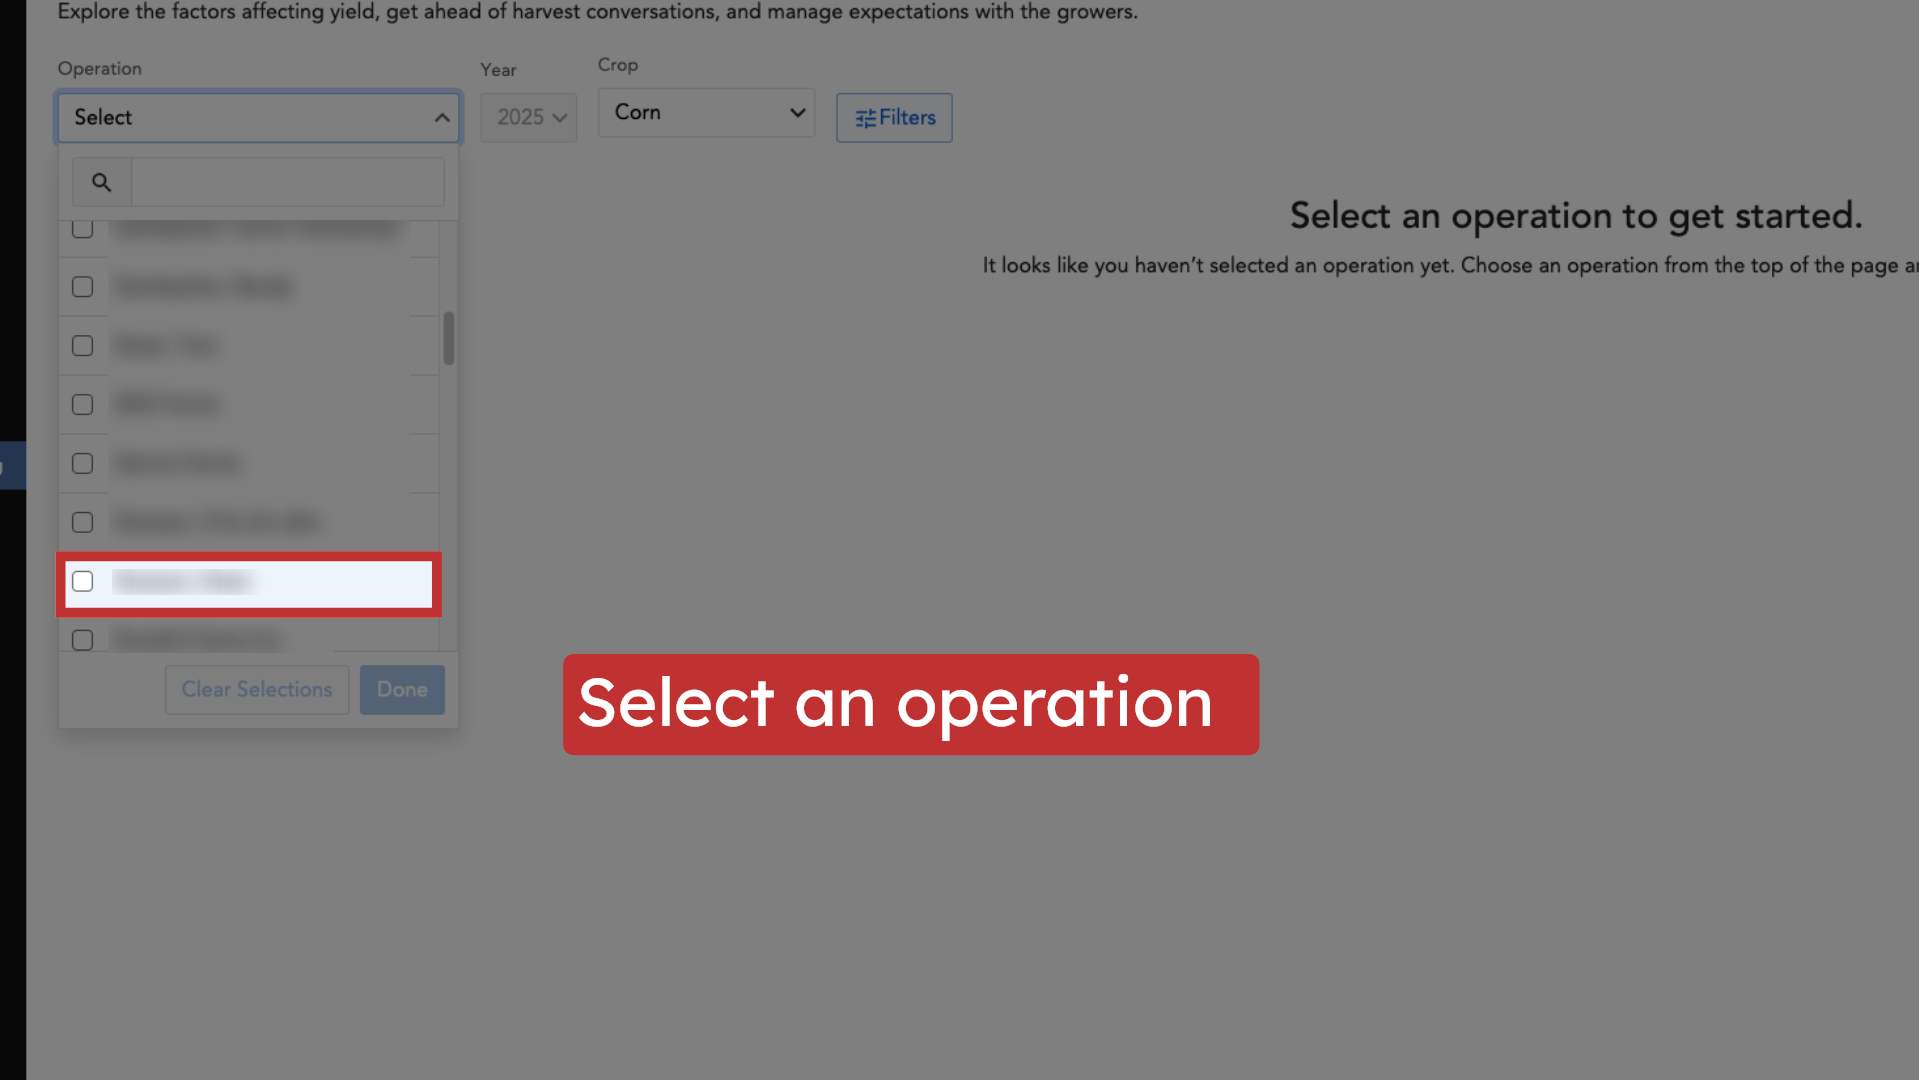
4. Select an operation
Use the menu to choose the specific operation(s) you wish to monitor and analyze.
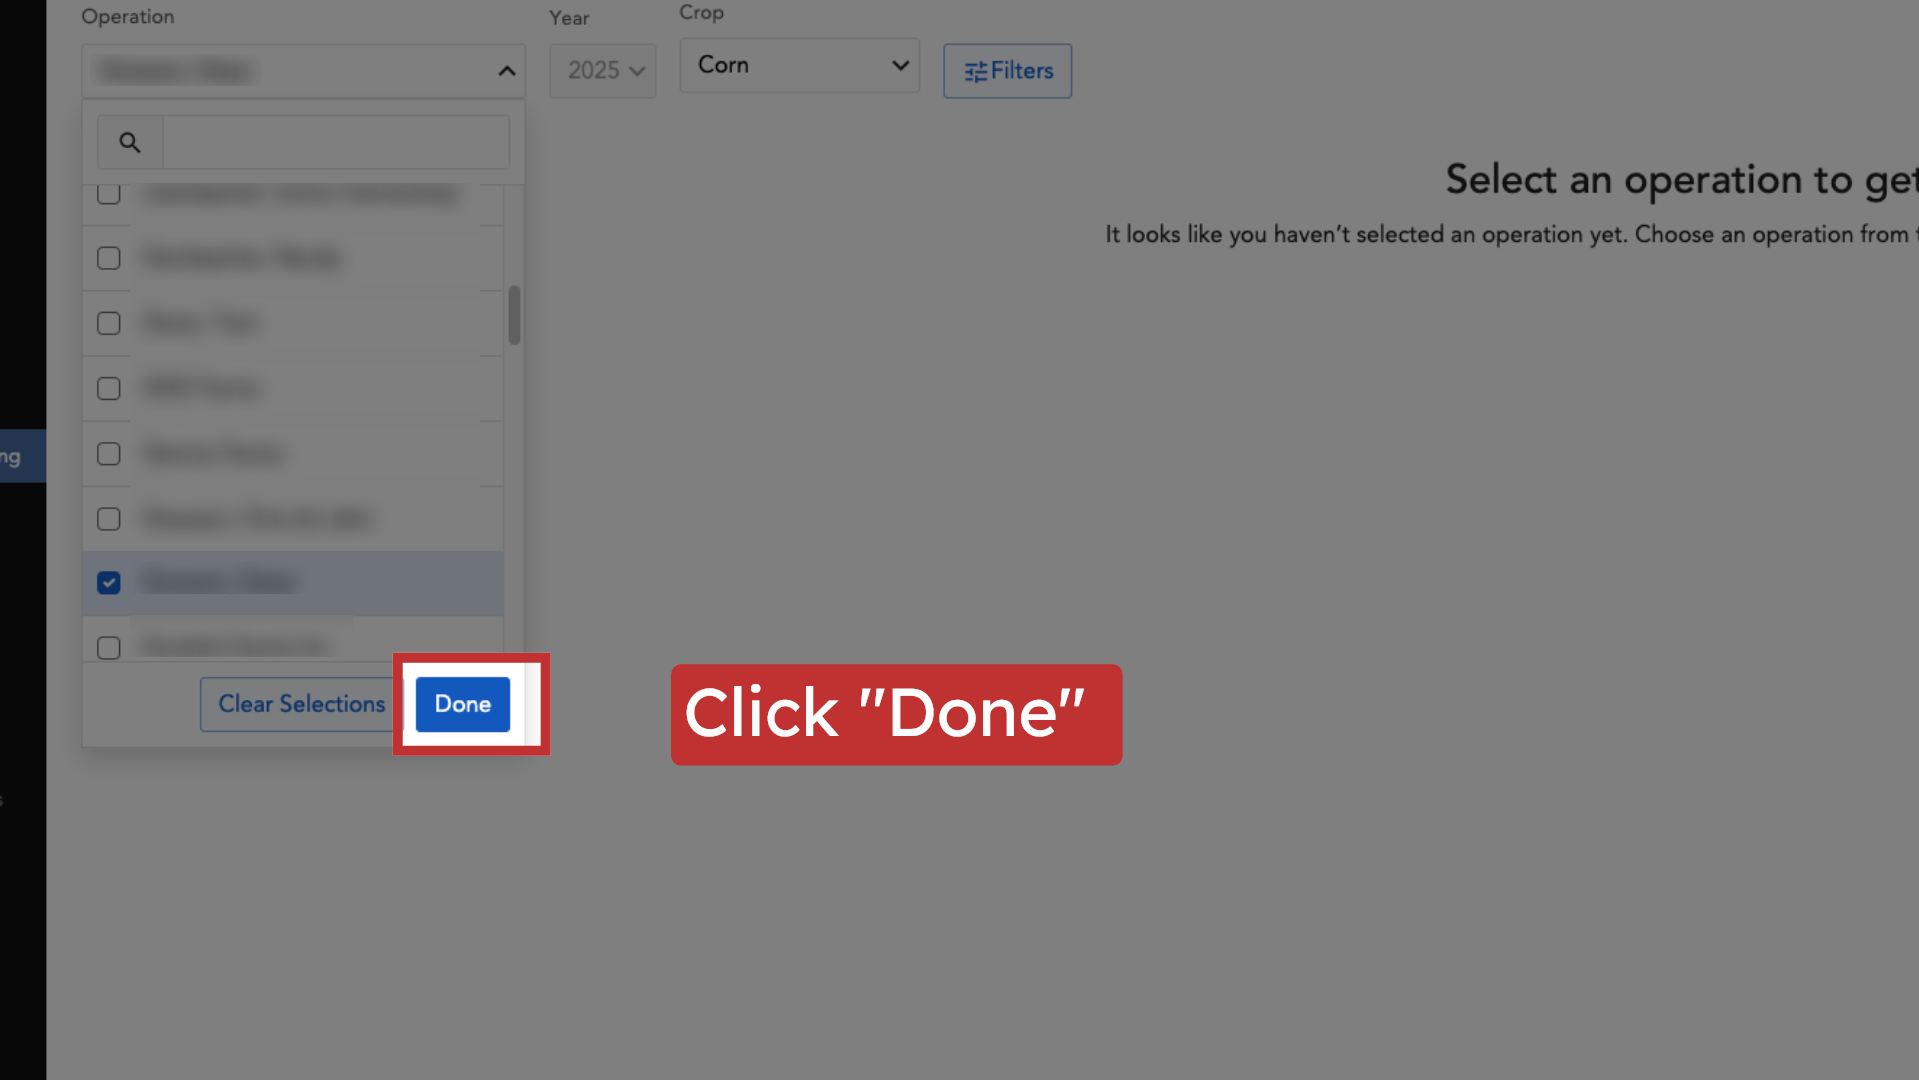
5. Click "Done"
Finalize your selection to load the dashboard and view the relevant field data.
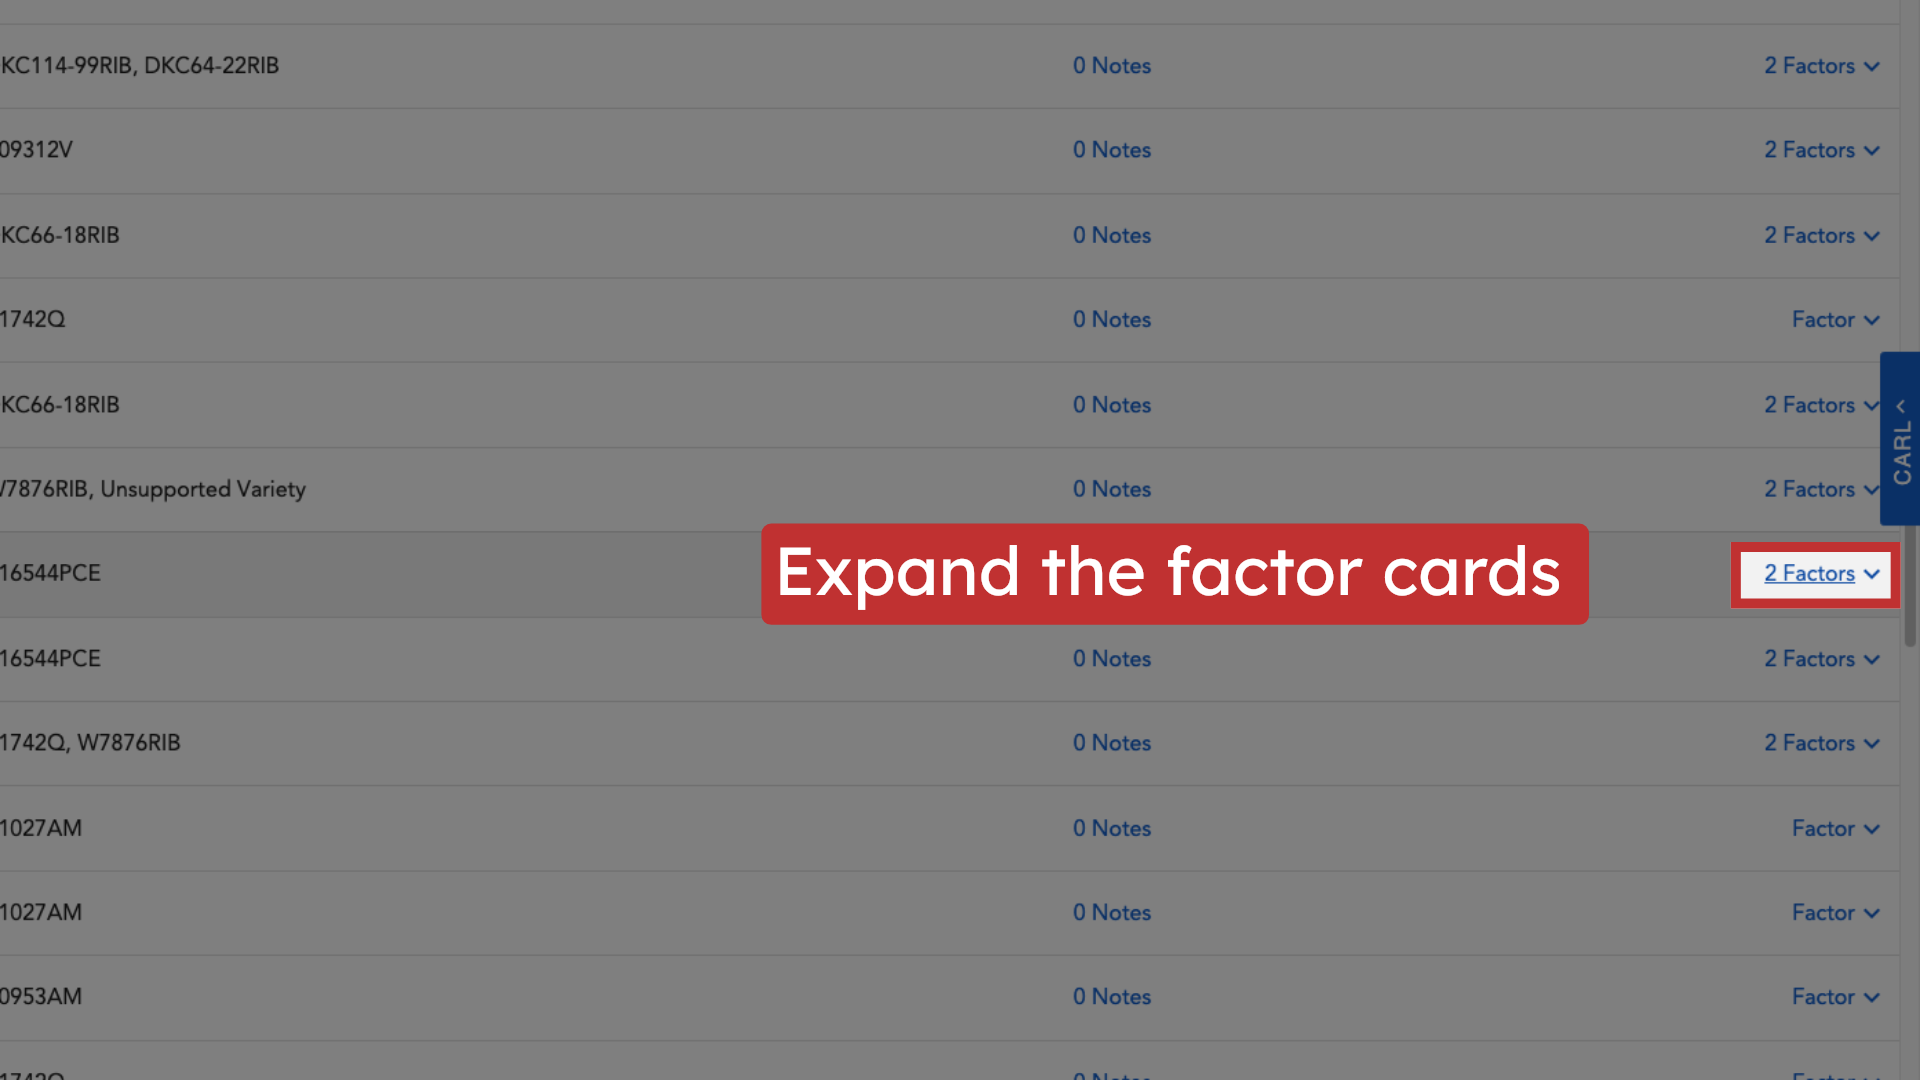
6. Expand the factor cards
For each field with a planting date and seed product, In-Season Monitoring displays factor cards. These cards are a daily digest of monitoring data and are the core of the feature.
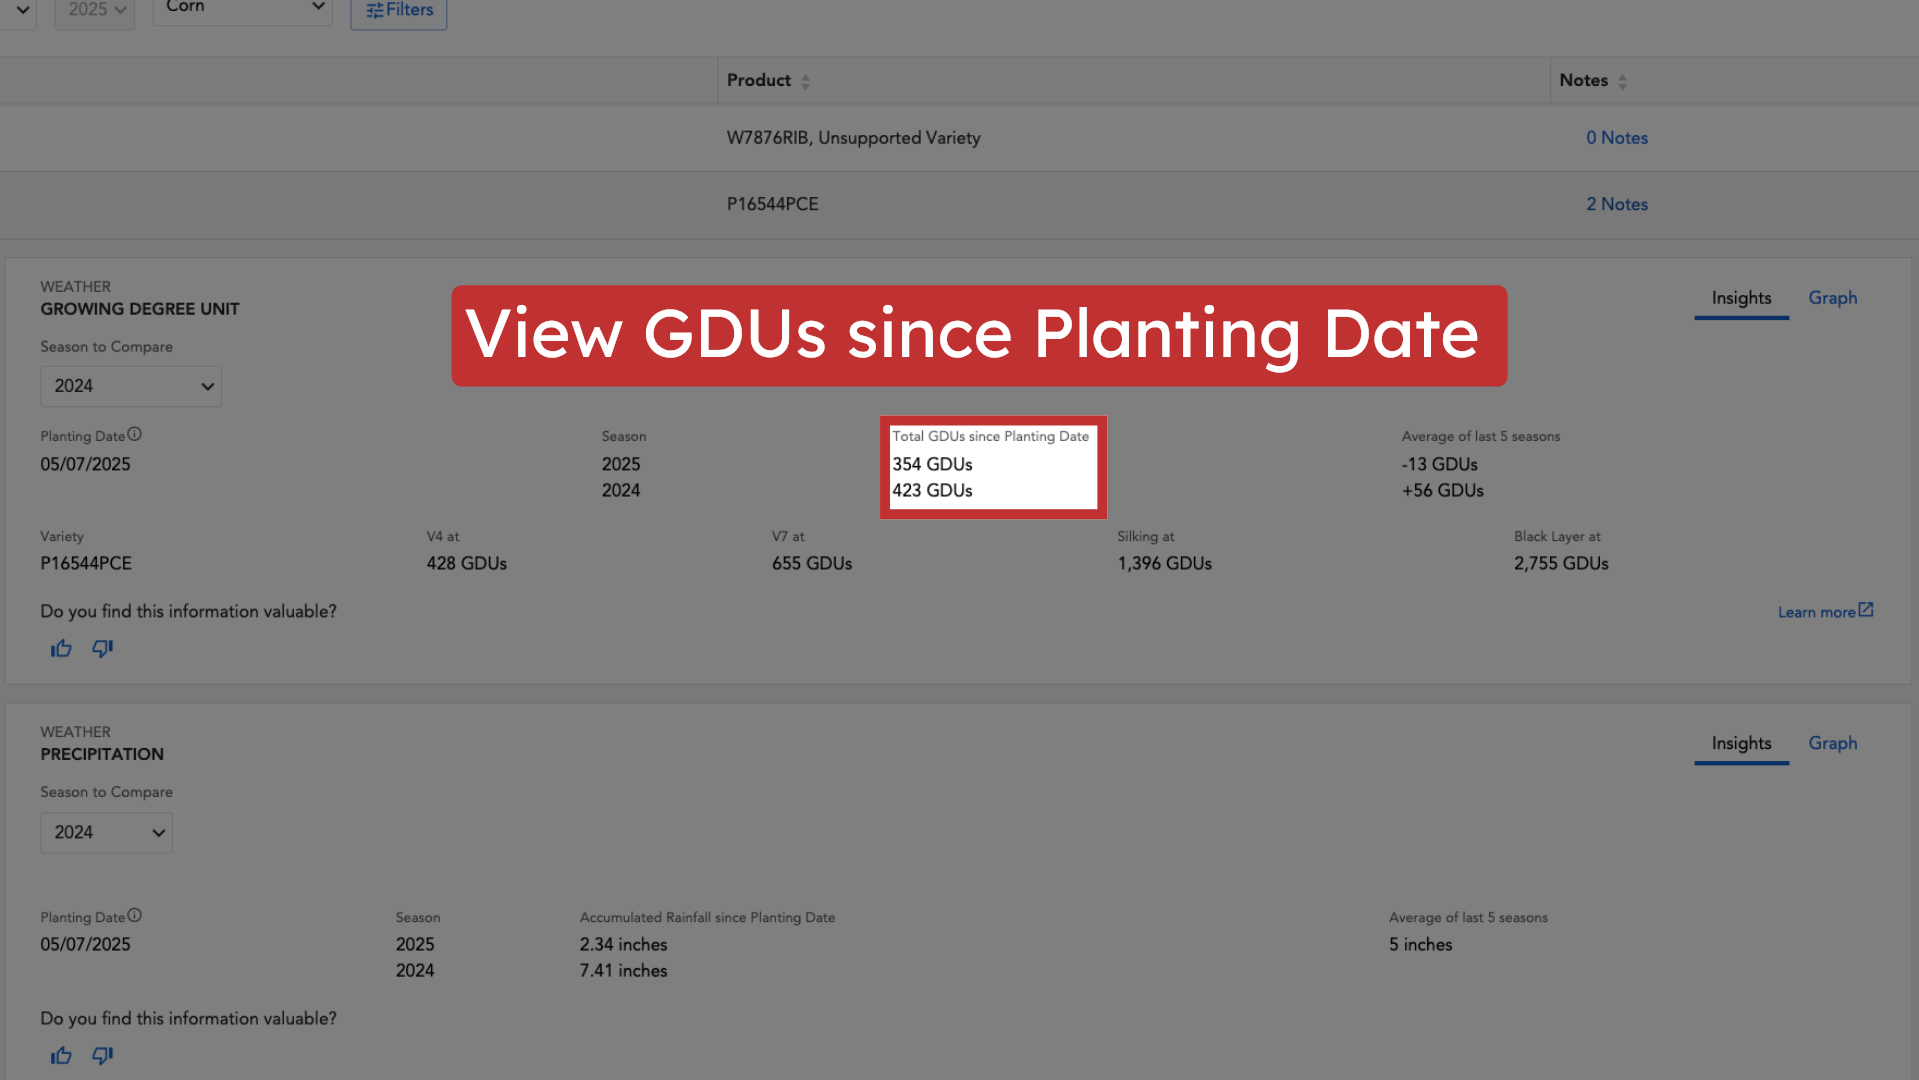
7. View GDUs since Planting Date
On the GDU factor card, you’ll see GDU accumulation since planting and the GDUs required to reach upcoming growth stages. Accurate planting data is essential for these calculations.
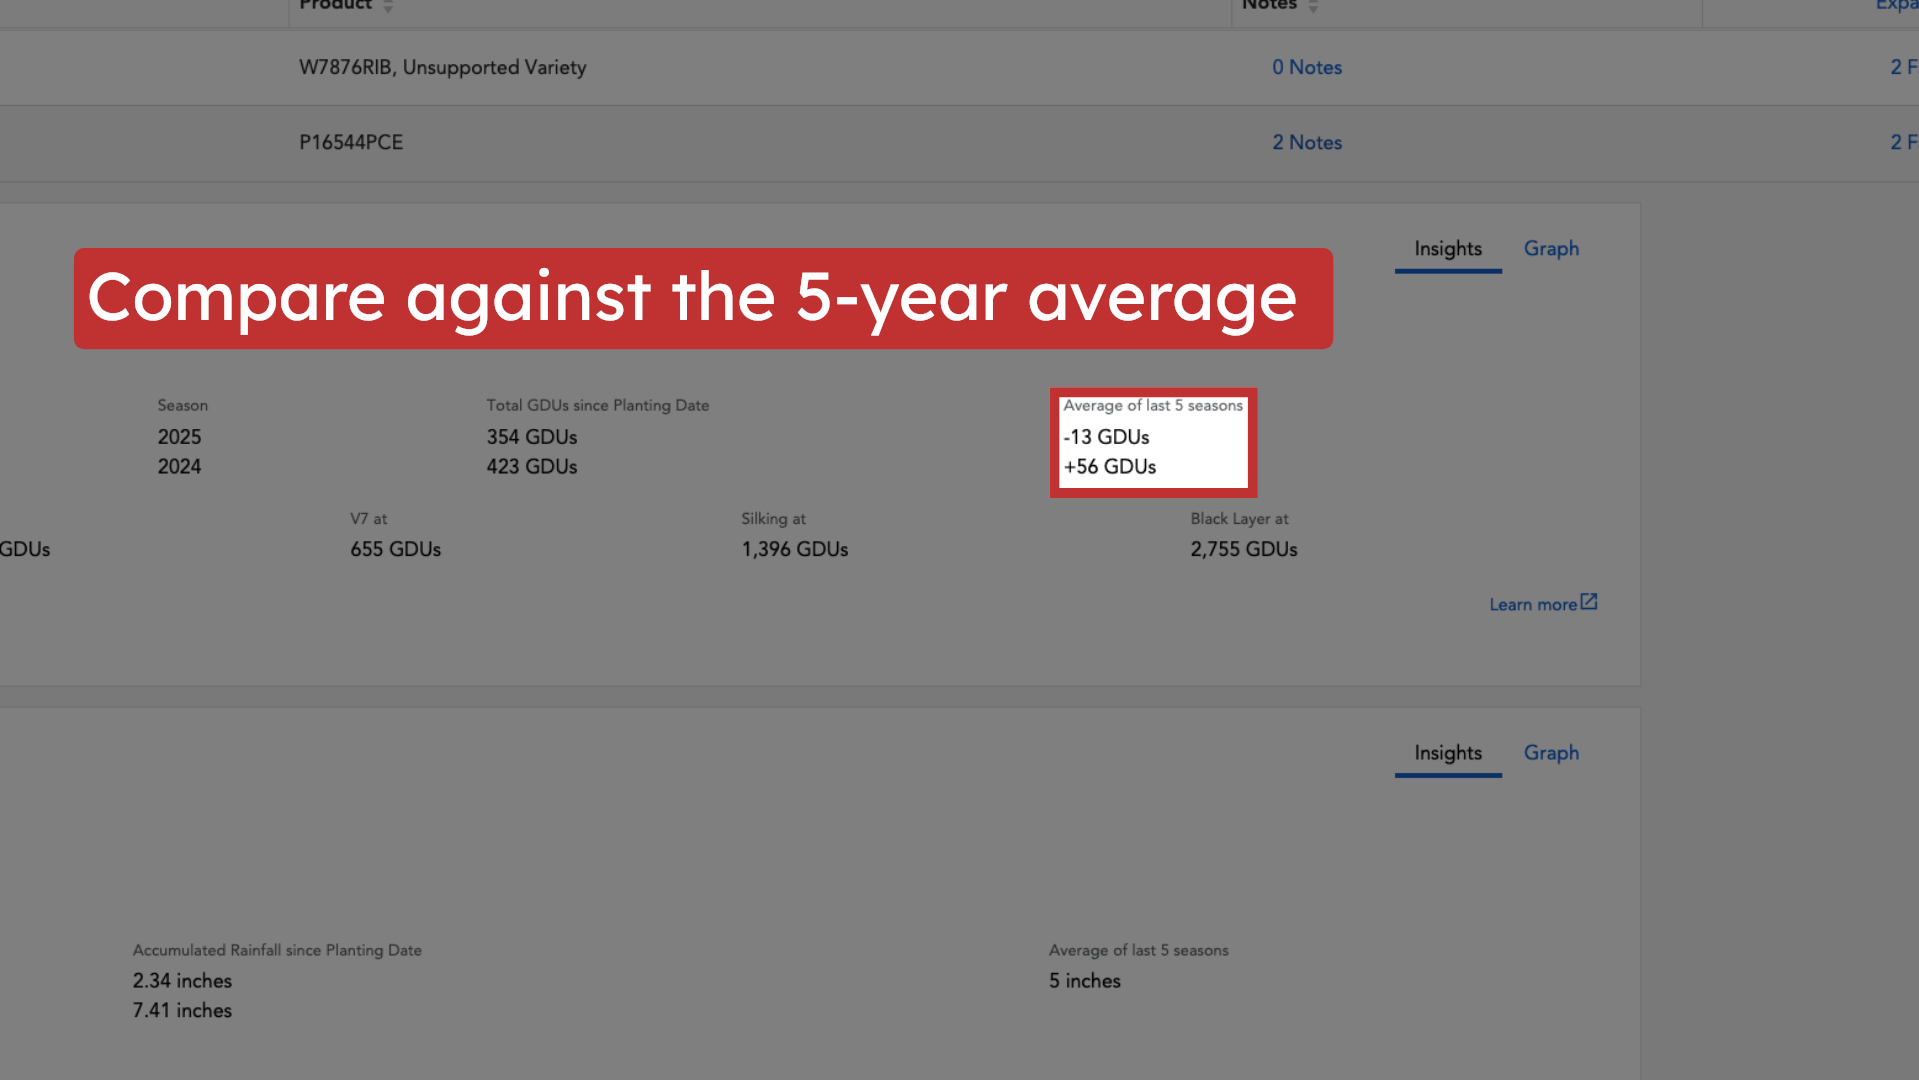
8. Compare against the 5-year average
The GDU card shows the current GDU accumulation compared to the 5-year average for that field.
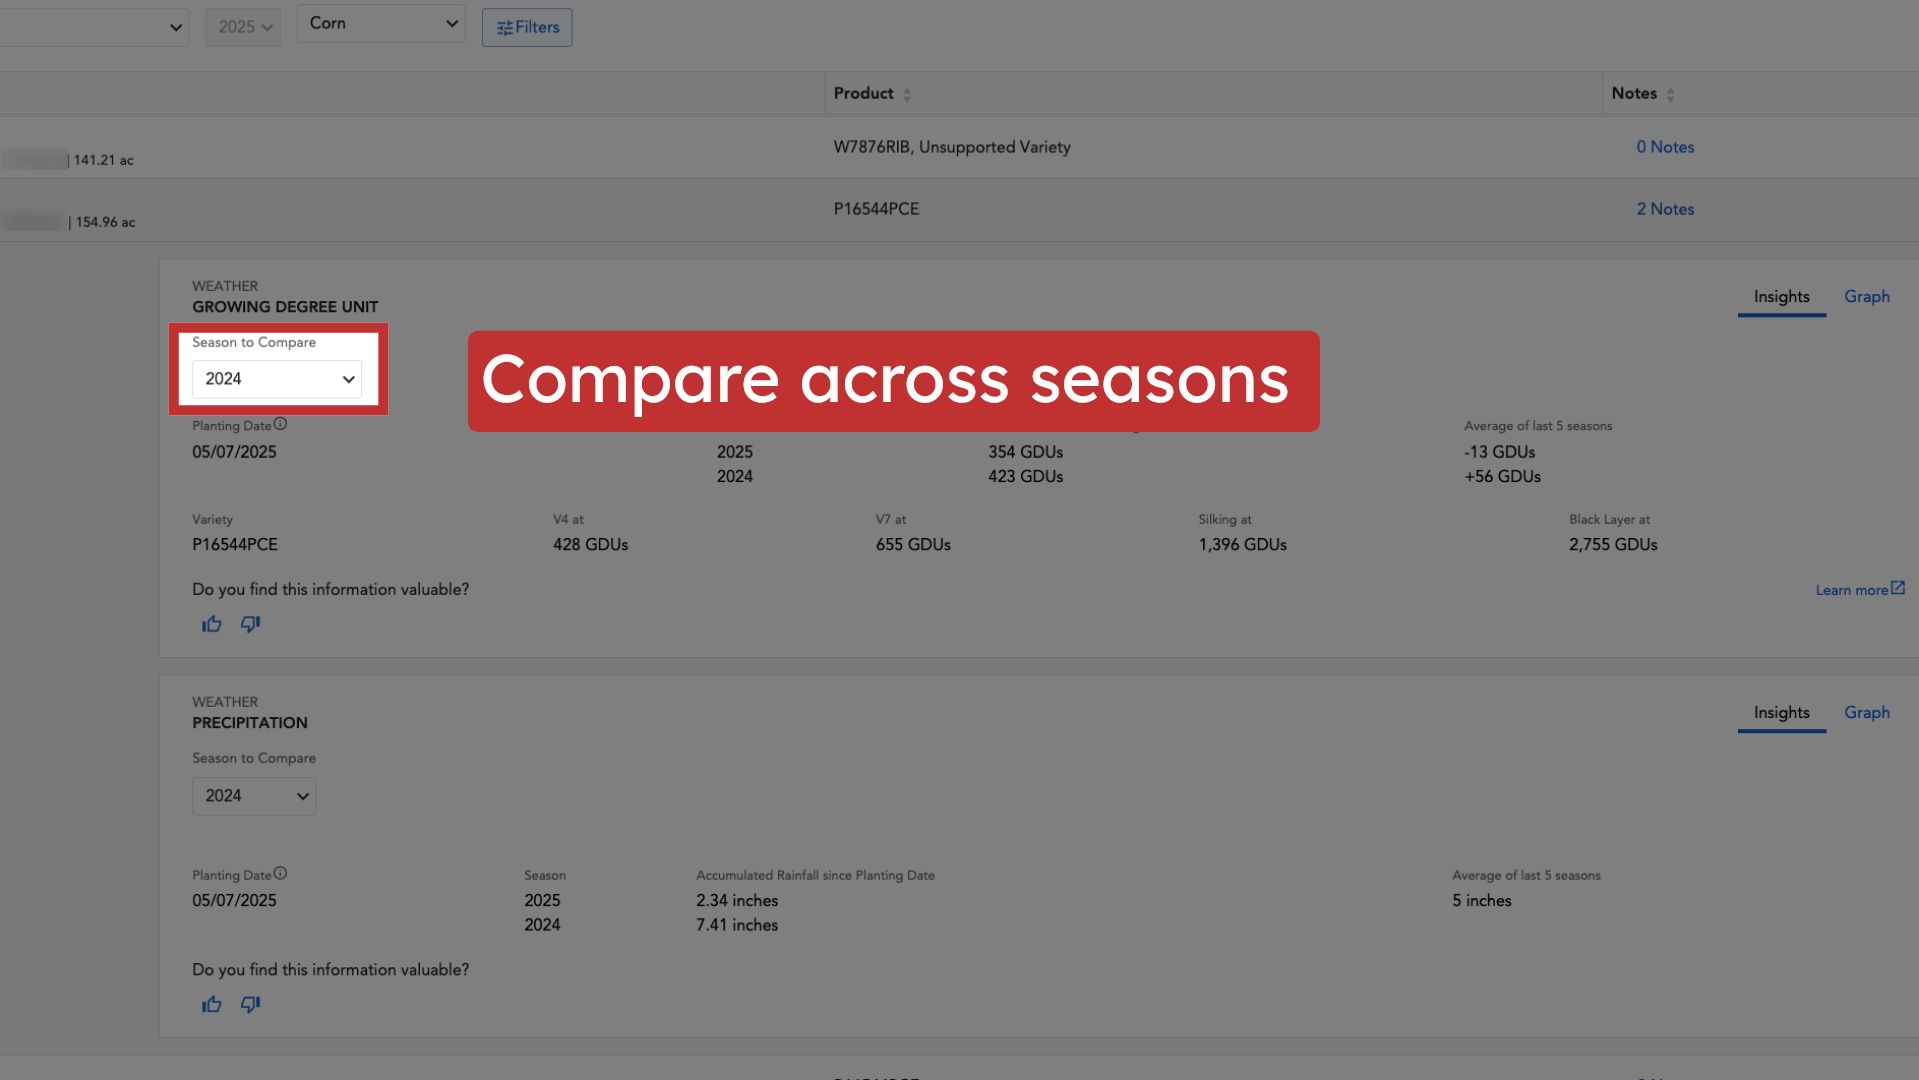
9. Compare across seasons
You can also see a seasonal GDU comparison for any of the past 5 individual years, allowing for more detailed historical context.
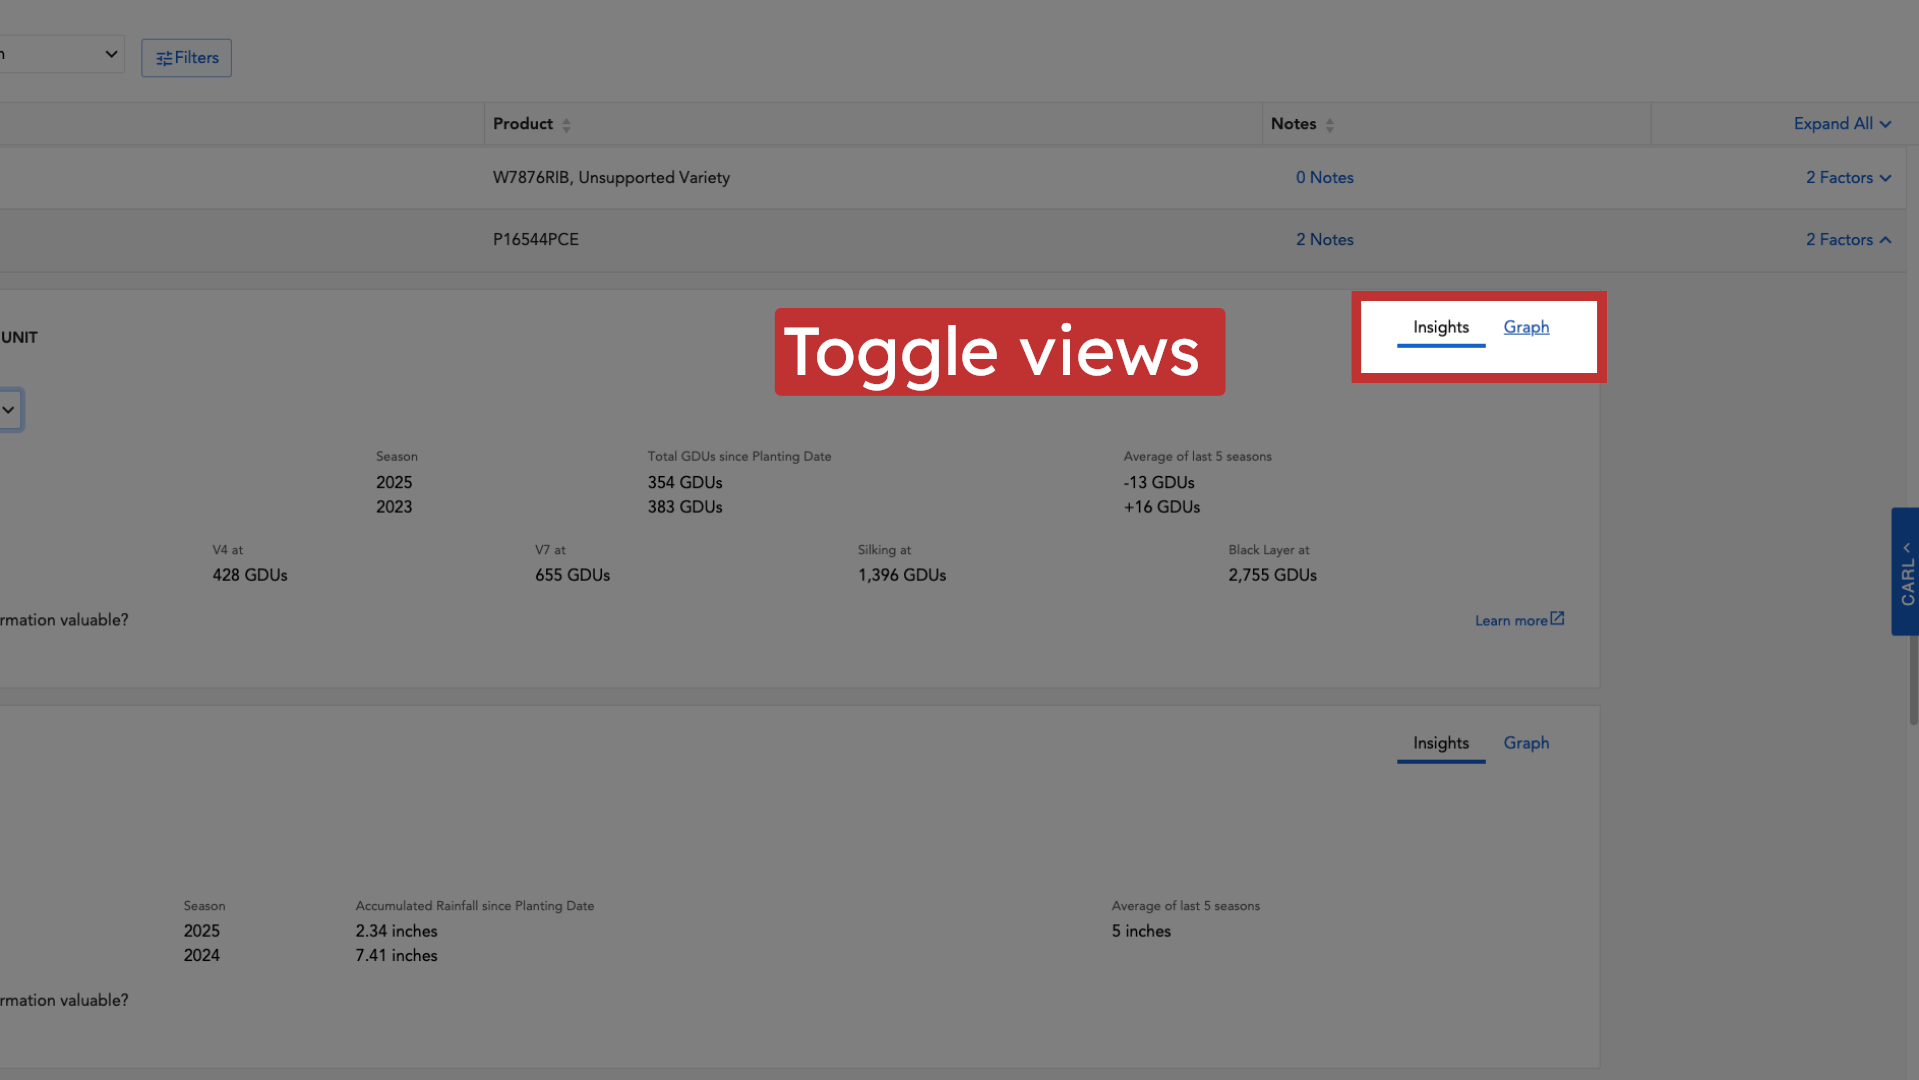
10. Toggle views
Toggle between "Insights" or "Graph" view on the GDU card to change how the data is depicted, according to your preference.
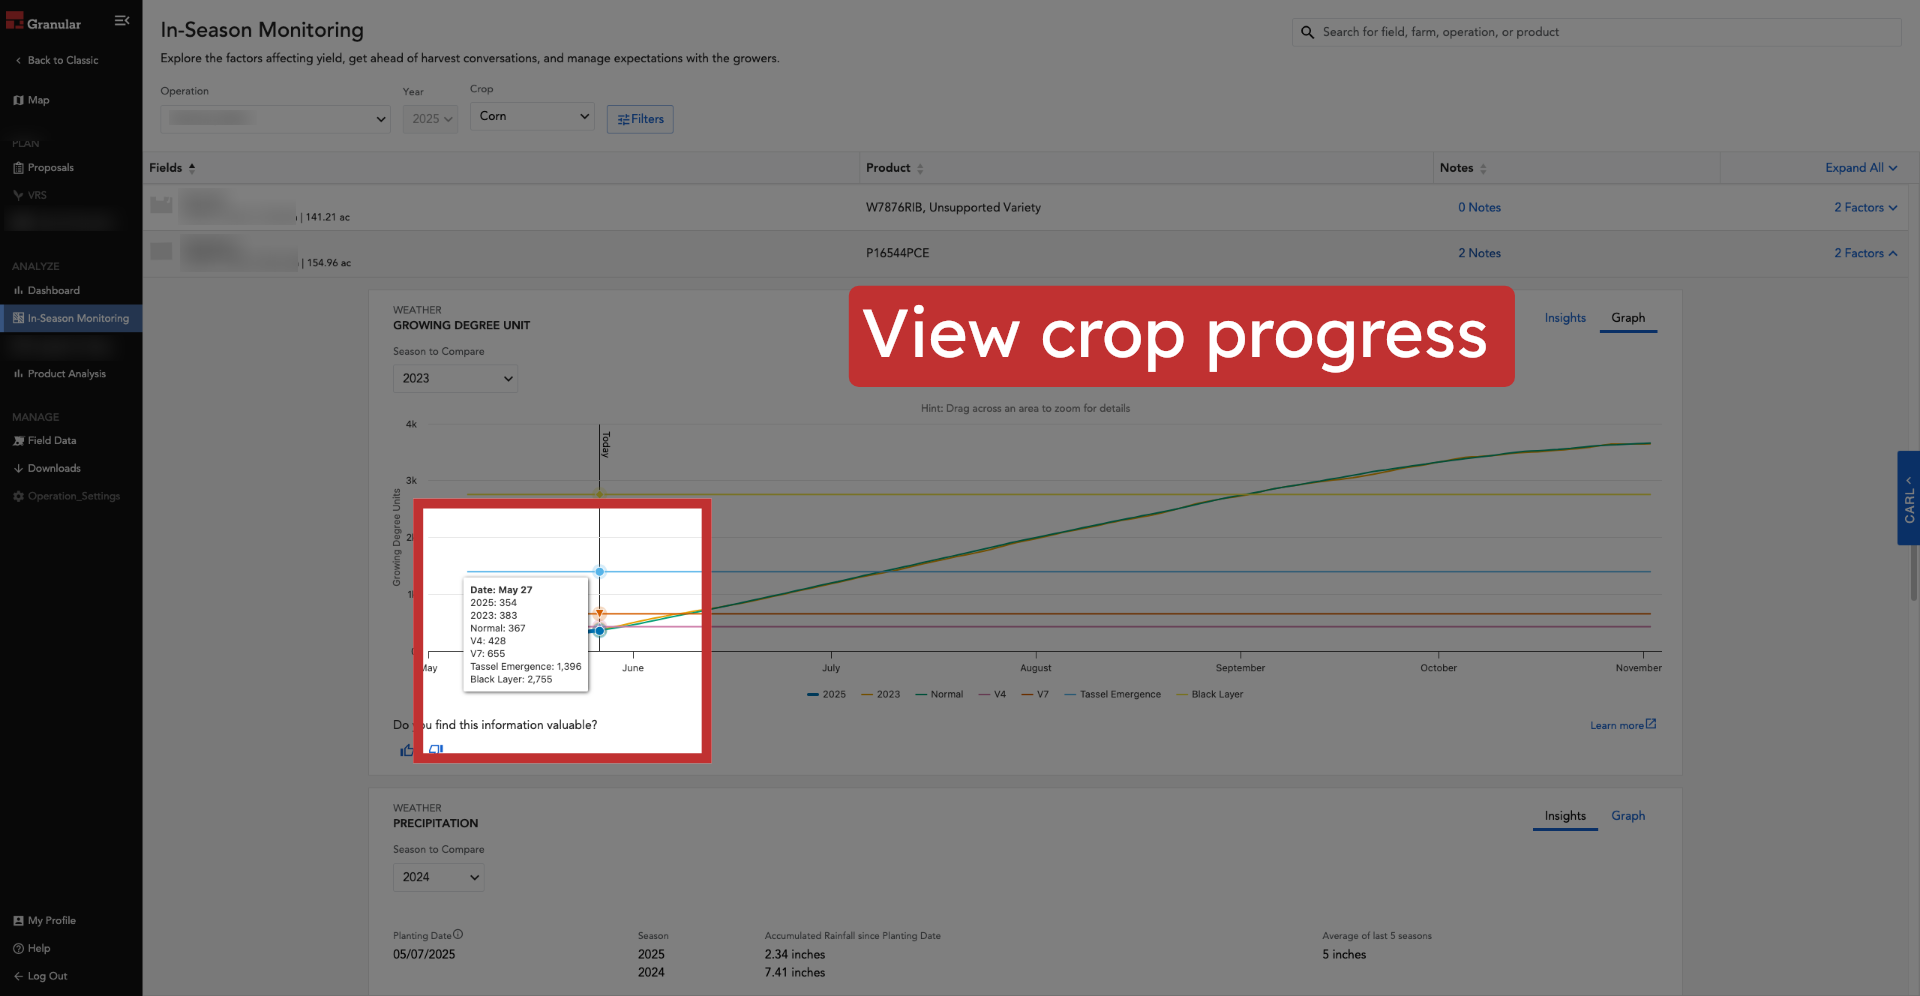
11. View crop progress
Utilize the GDU card's comparisons (against the 5-year average and individual past seasons) to understand current crop progress relative to historical trends.
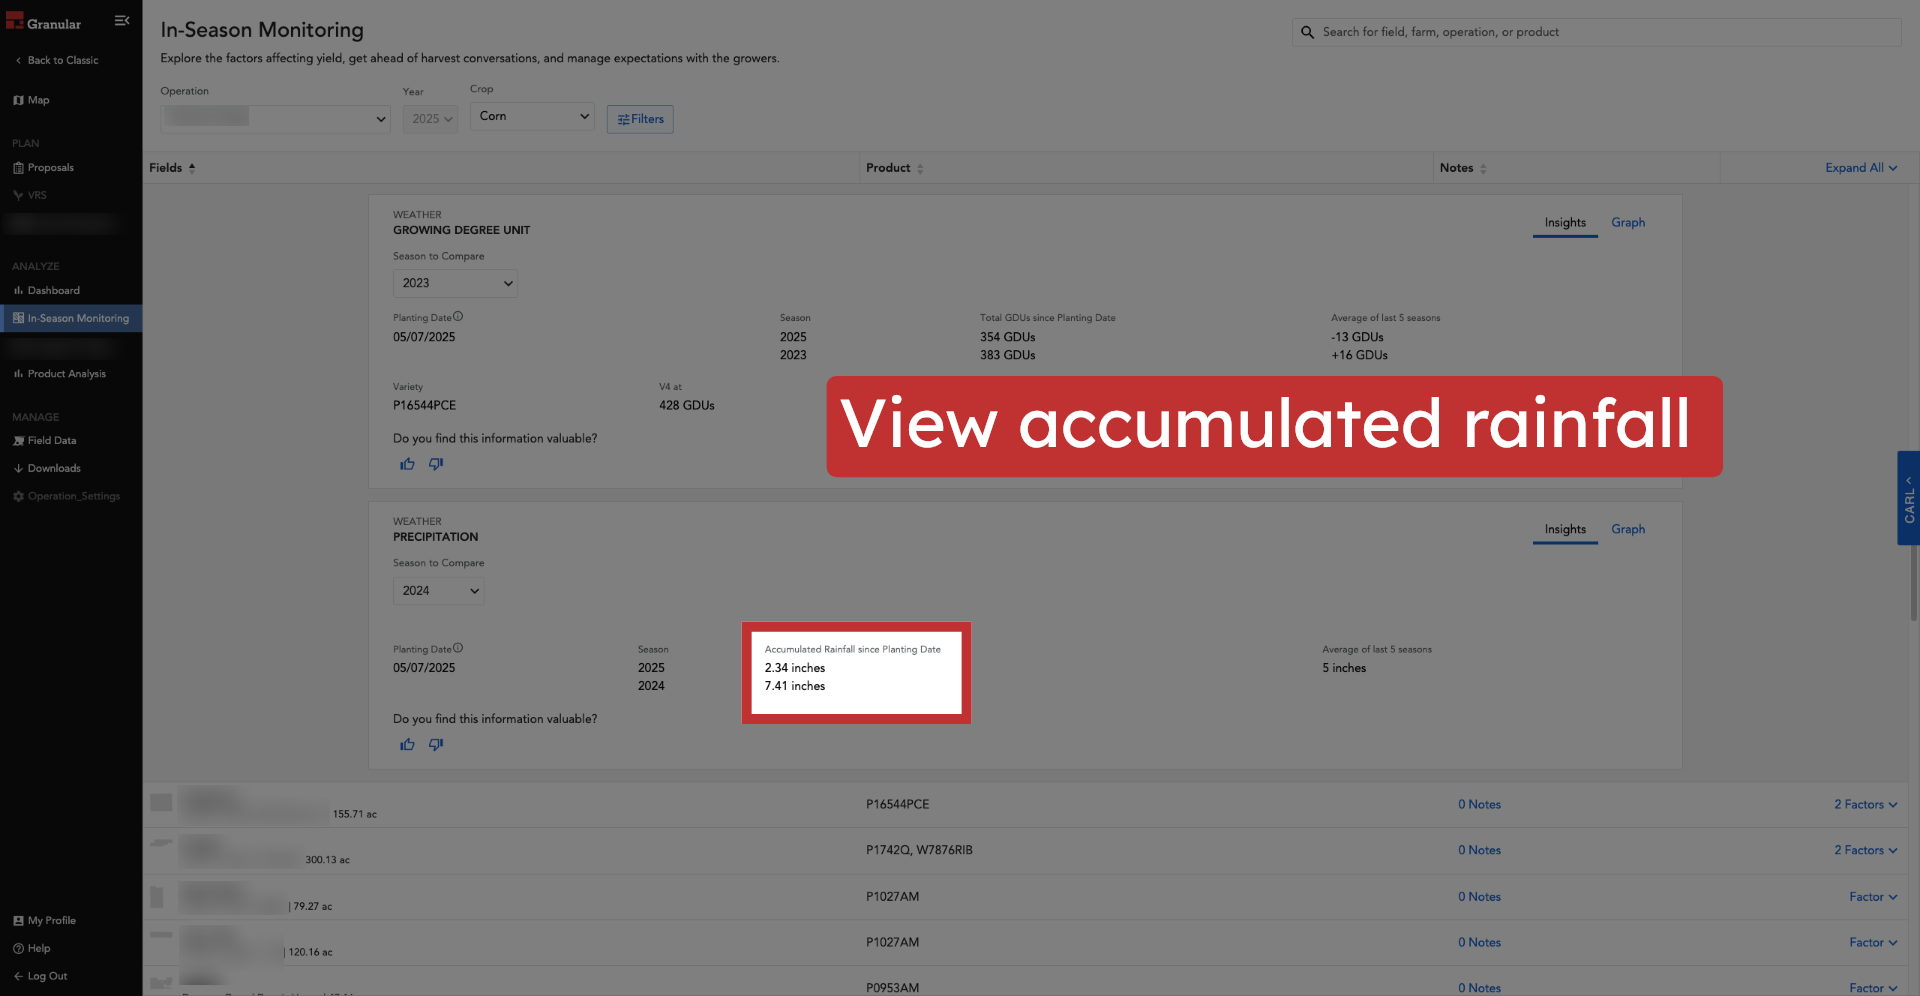
12. View accumulated rainfall
On the Precipitation factor card, you’ll see the accumulated rainfall since the planting date for the selected field.
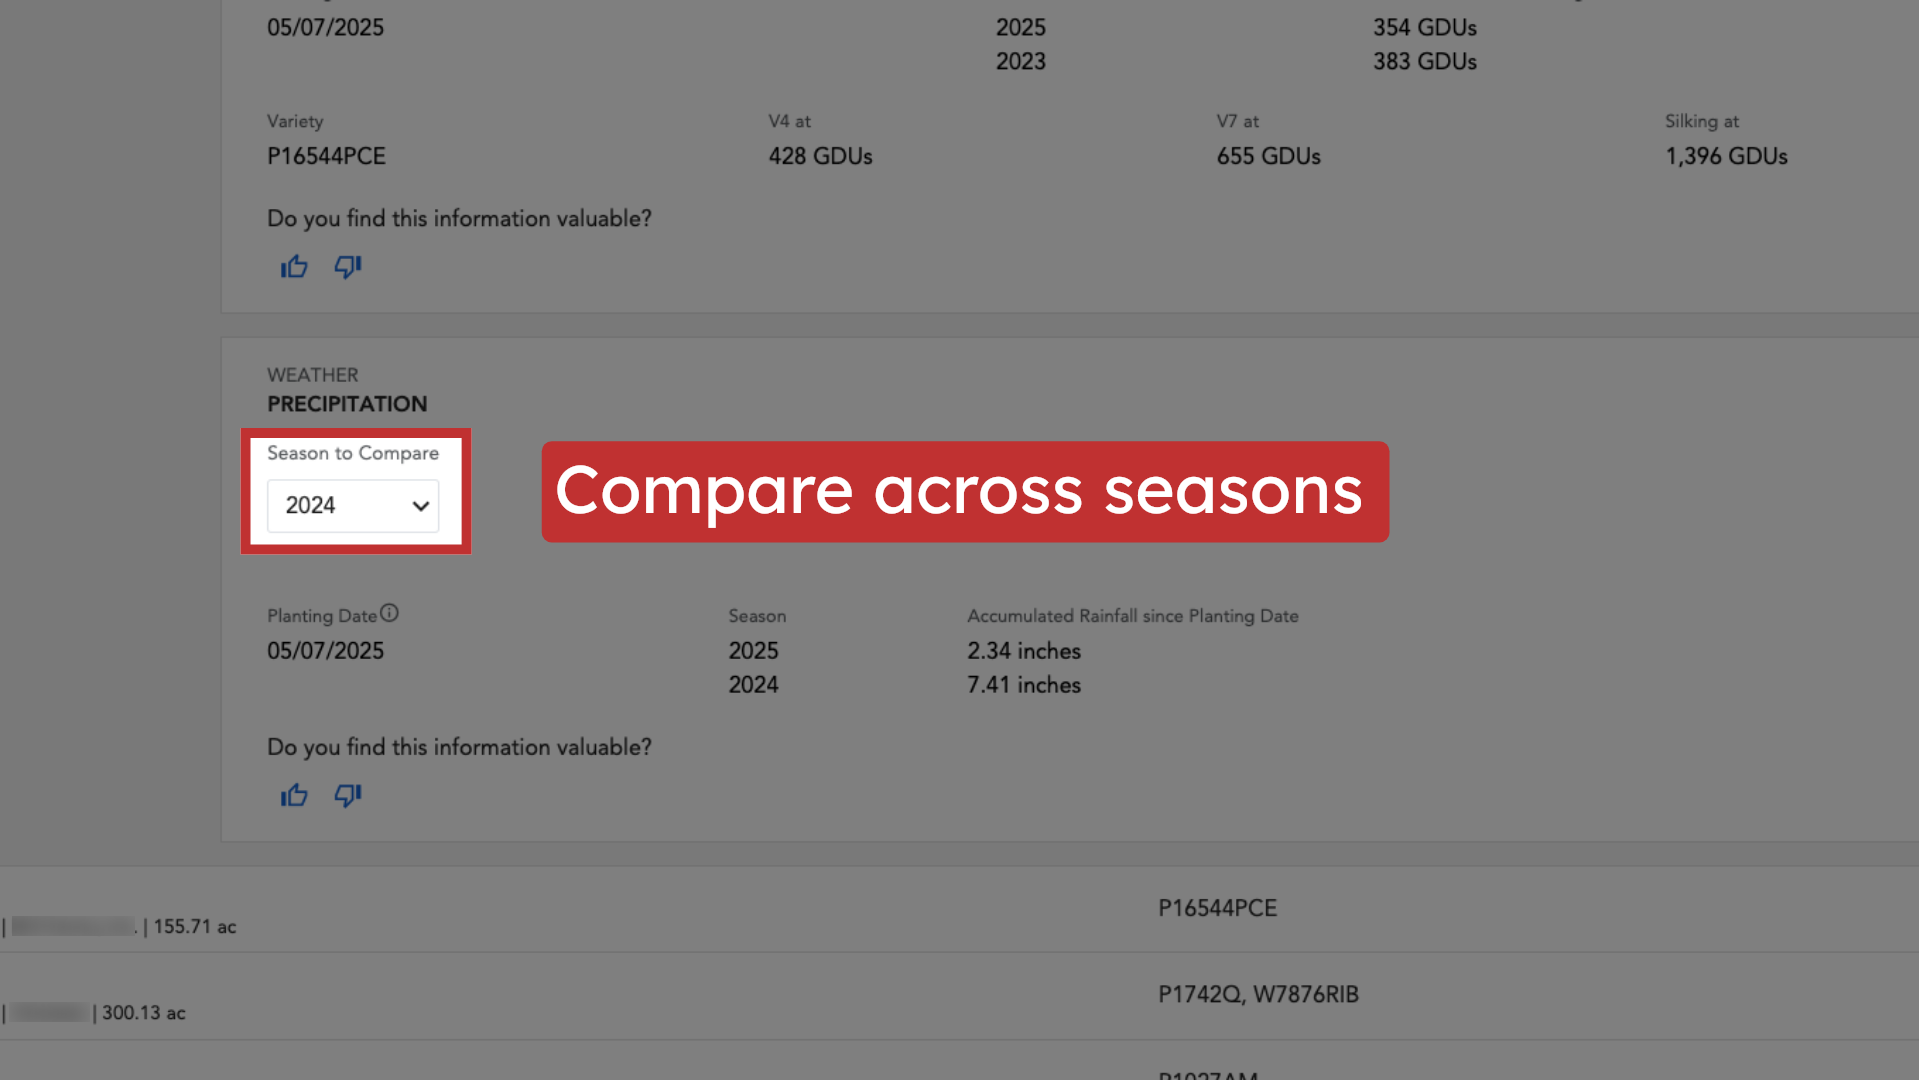
13. Compare across seasons
The Precipitation card displays current precipitation data compared to the 5-year average and includes a dropdown to compare this season to any single previous season's rainfall.
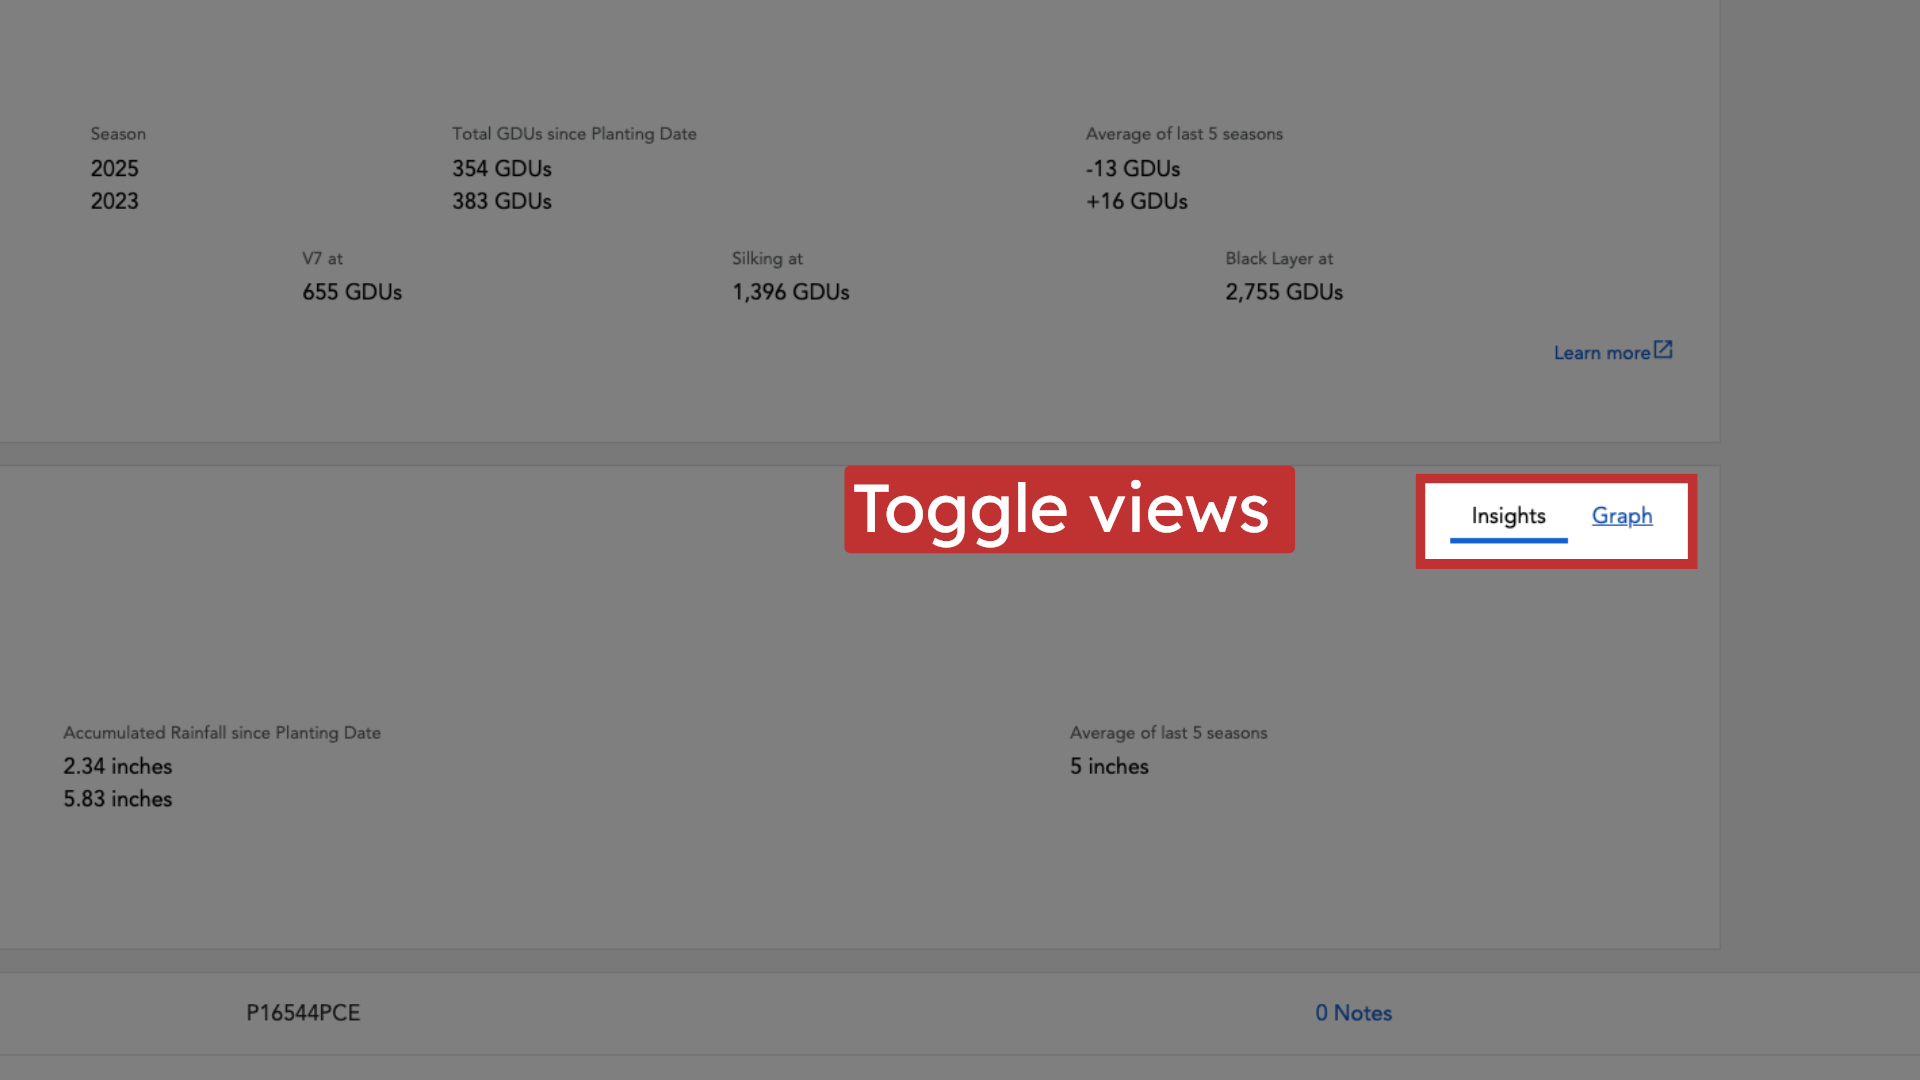
14. Toggle views
Just like the GDU card, you can toggle between "Insights" or "Graph" view on the Precipitation card to visualize the data.
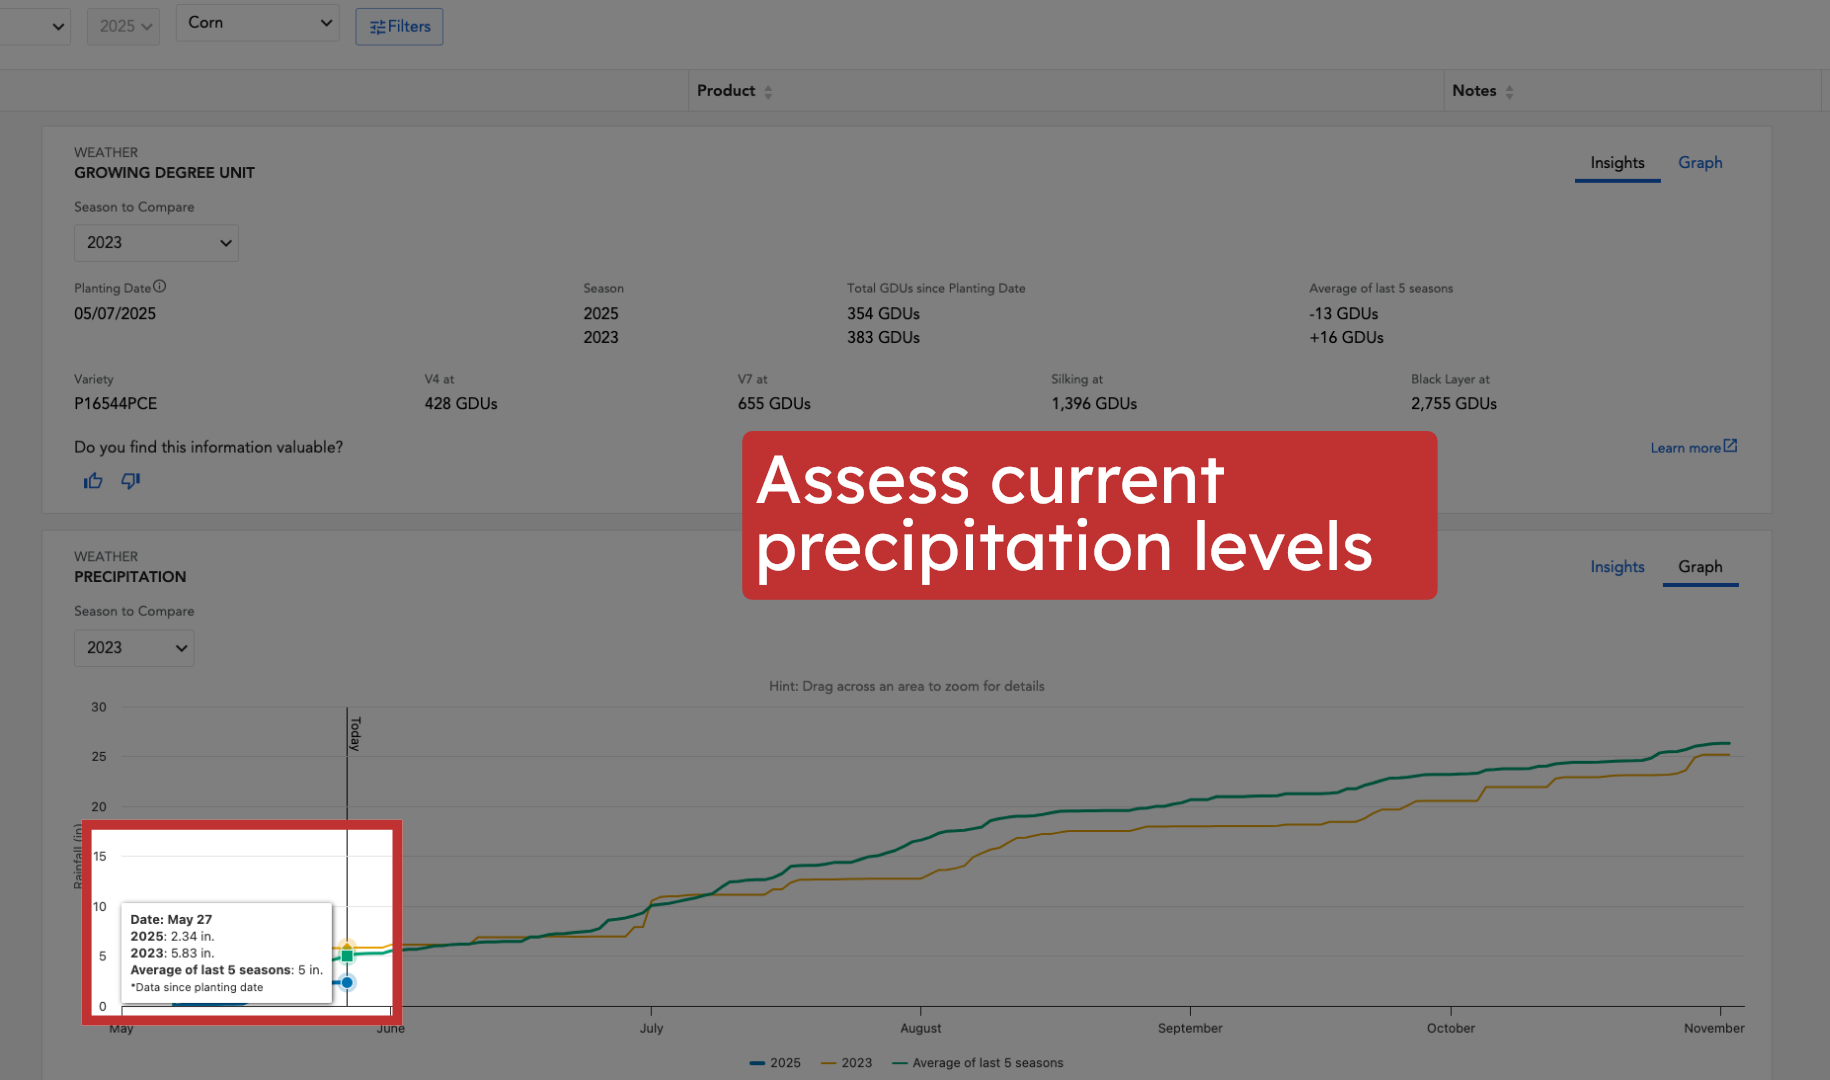
15. Assess current precipitation levels
Use the Precipitation card's comparisons (against the 5-year average and individual past seasons) to assess current moisture levels in the context of previous years.
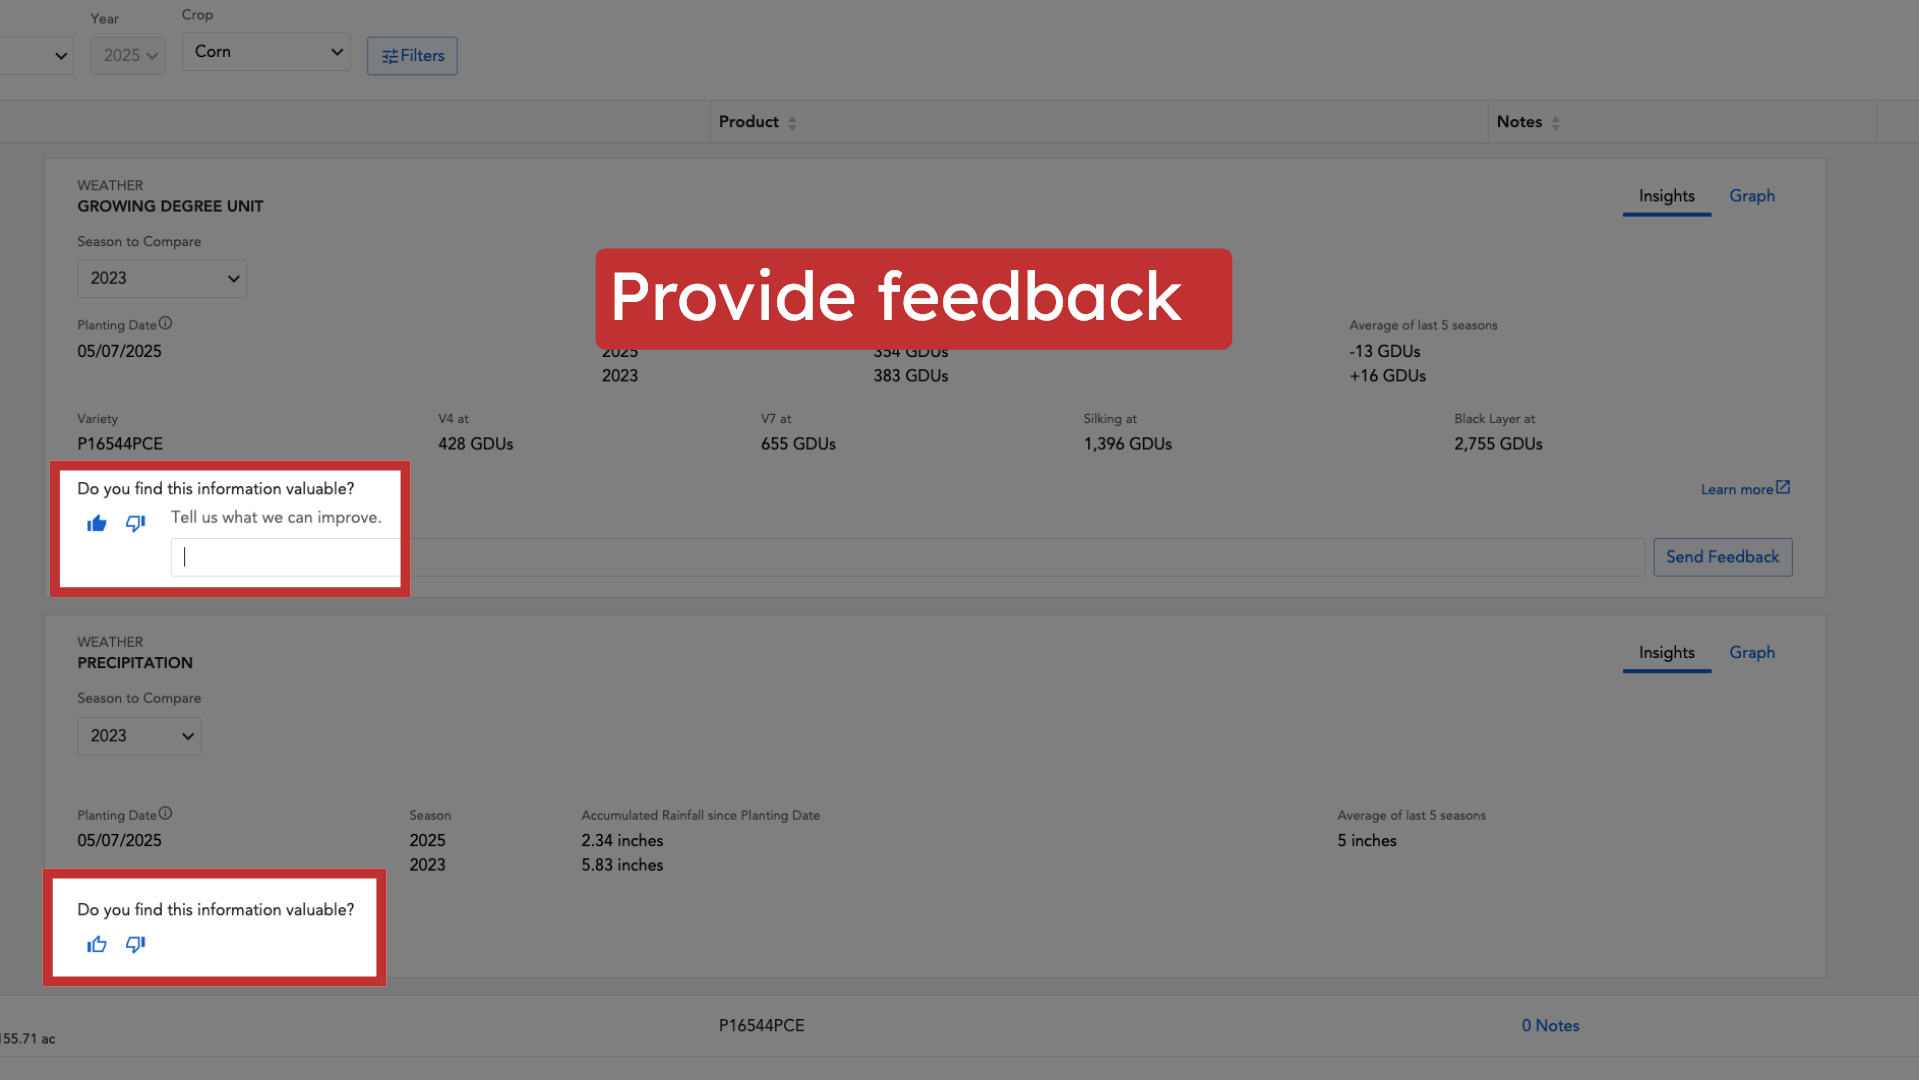
16. Provide feedback
Each factor card offers a space for you to provide feedback. This helps you ground-truth how the data reconciles with what you are seeing in the field and helps us improve the tool.
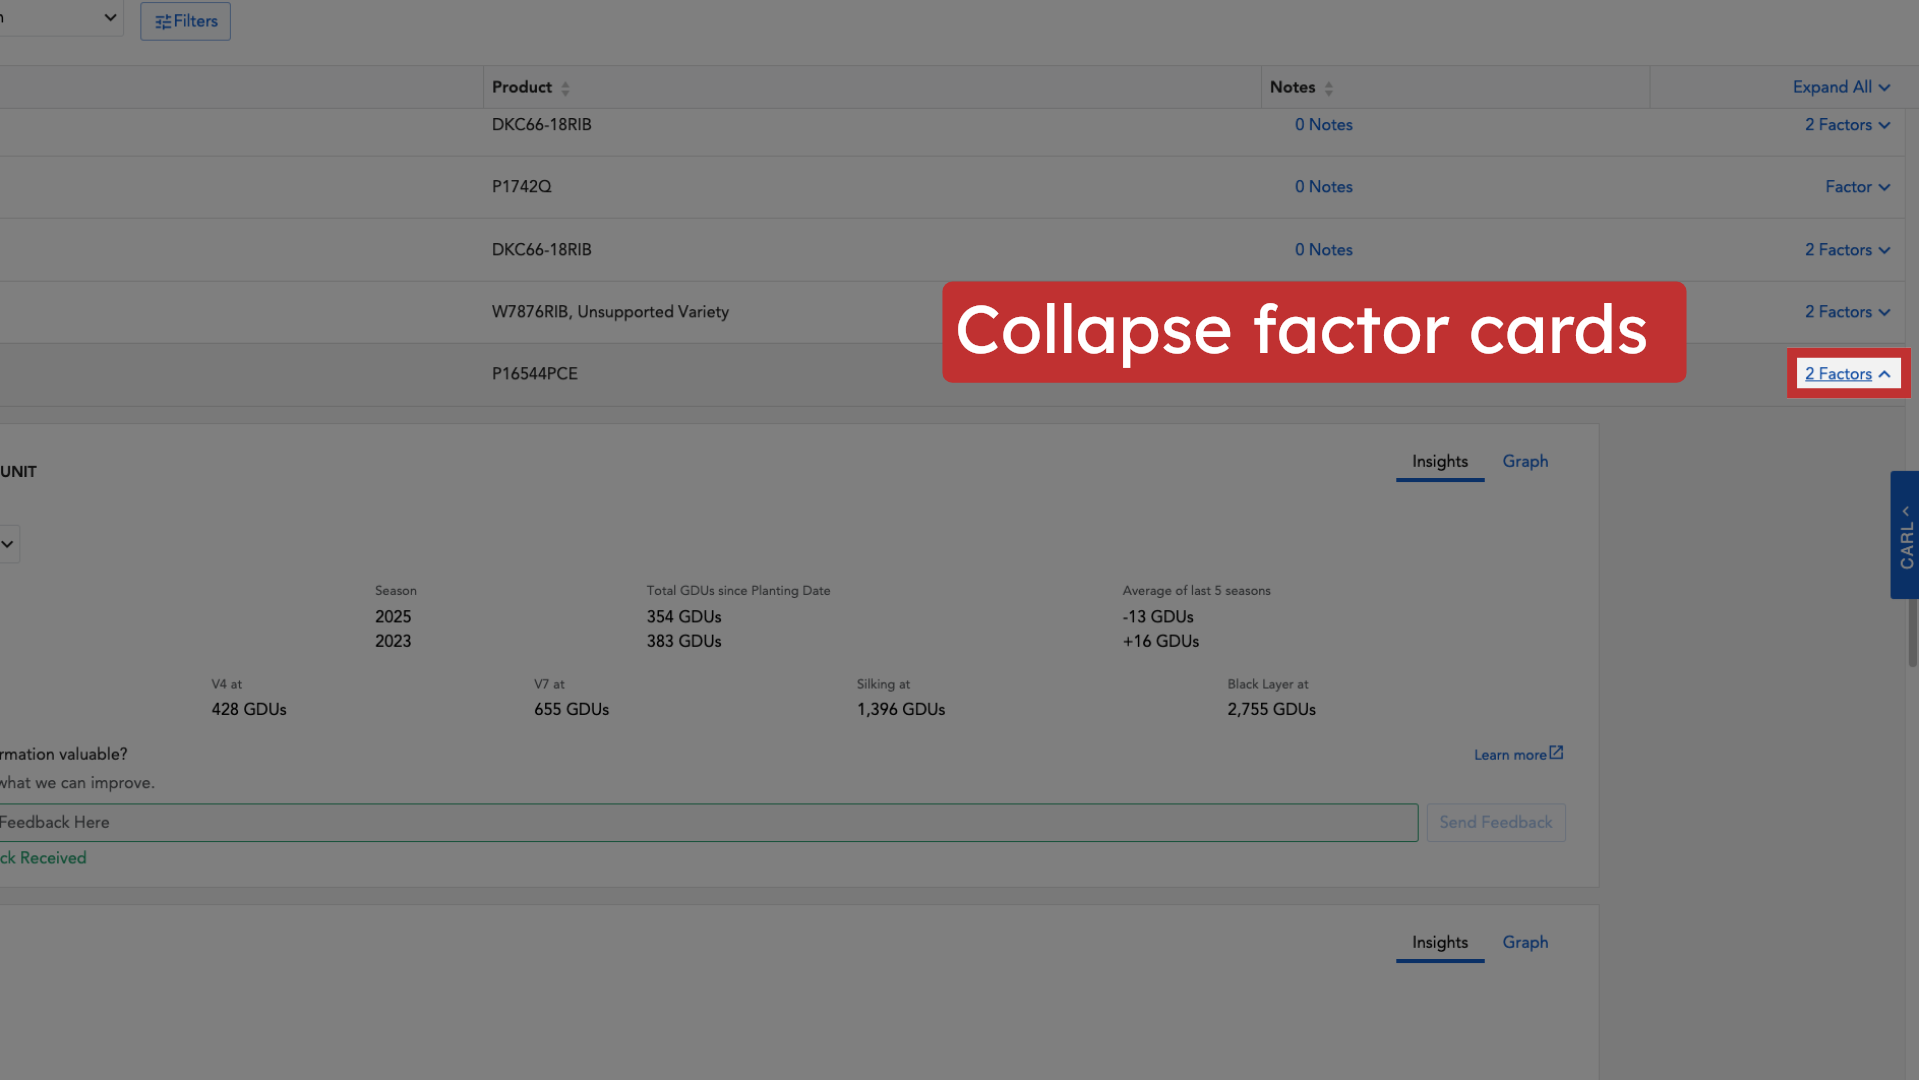
17. Collapse factor cards
Once you've reviewed the information, you can collapse the factor cards to return to a summary view of your fields.
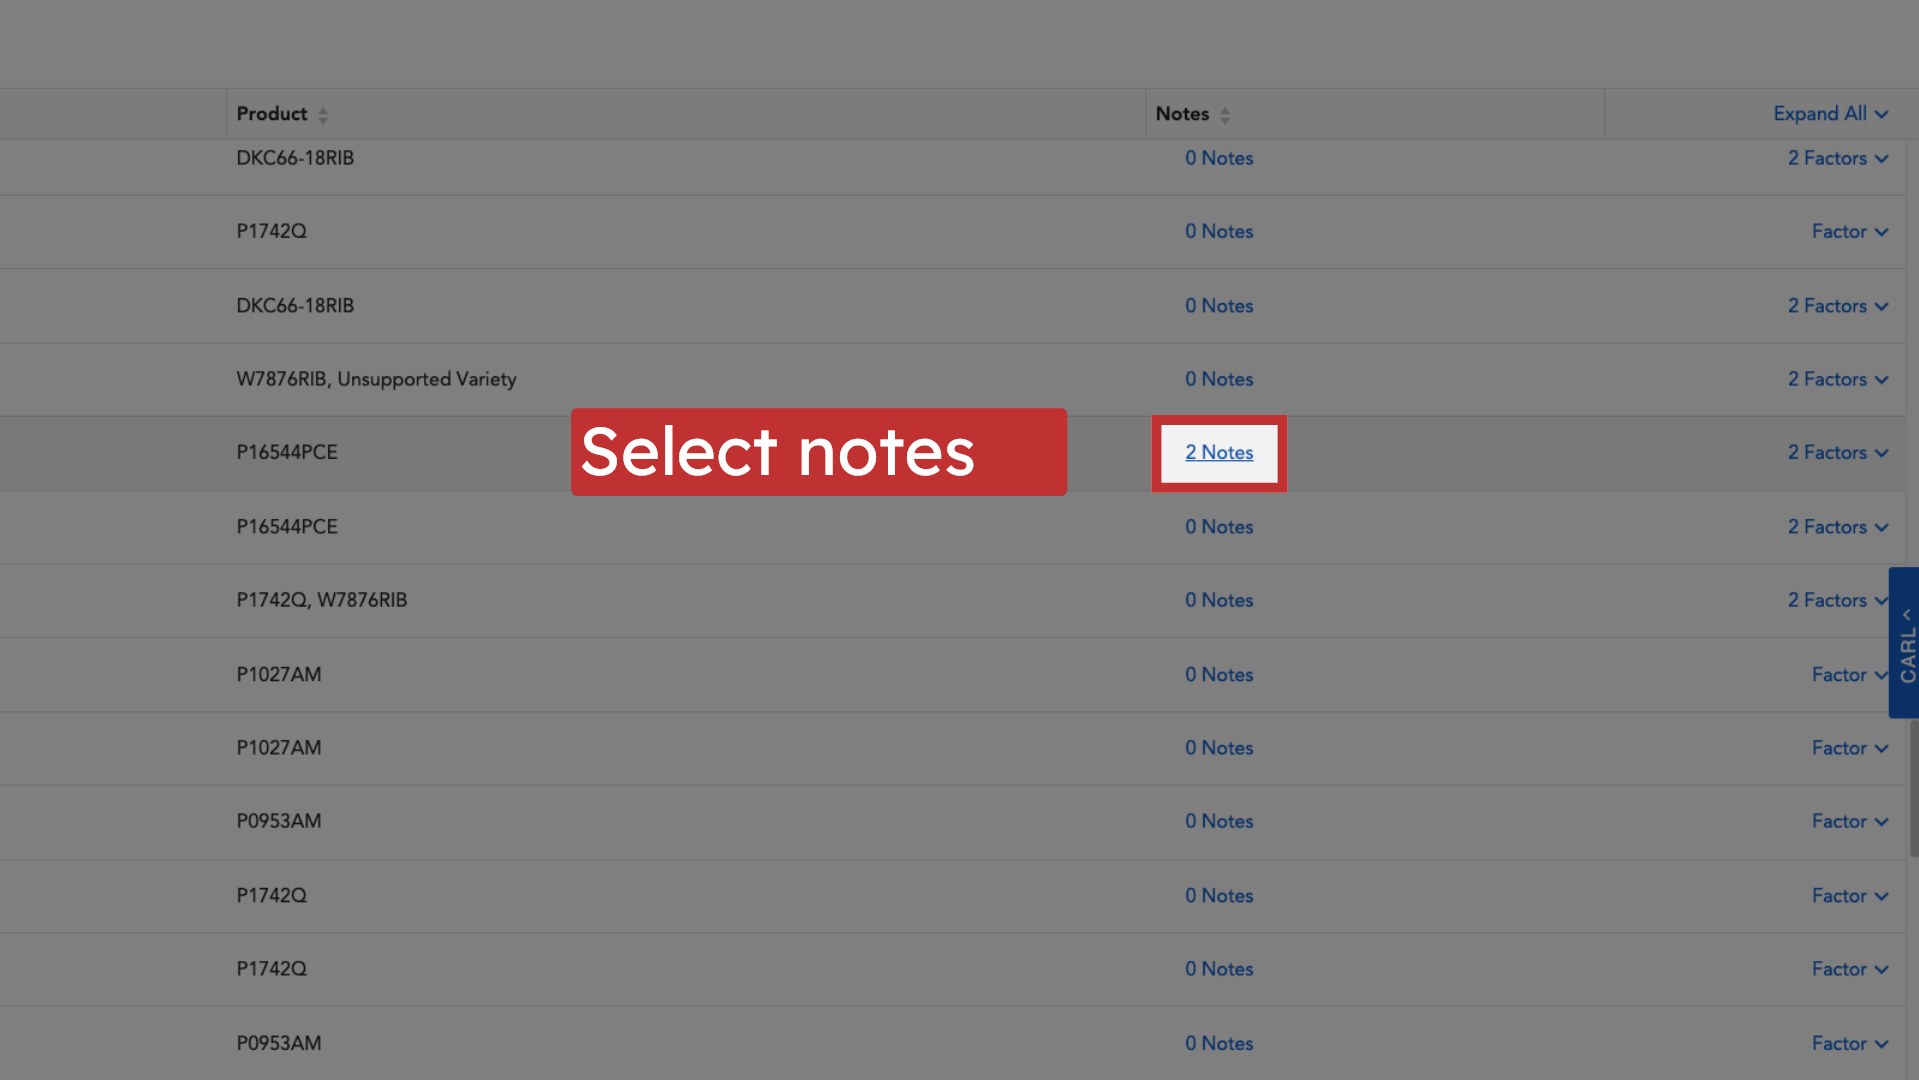
18. Select notes
In-Season Monitoring features integrated field notes. Access previously collected notes and photos, organized by field, directly from the dashboard.
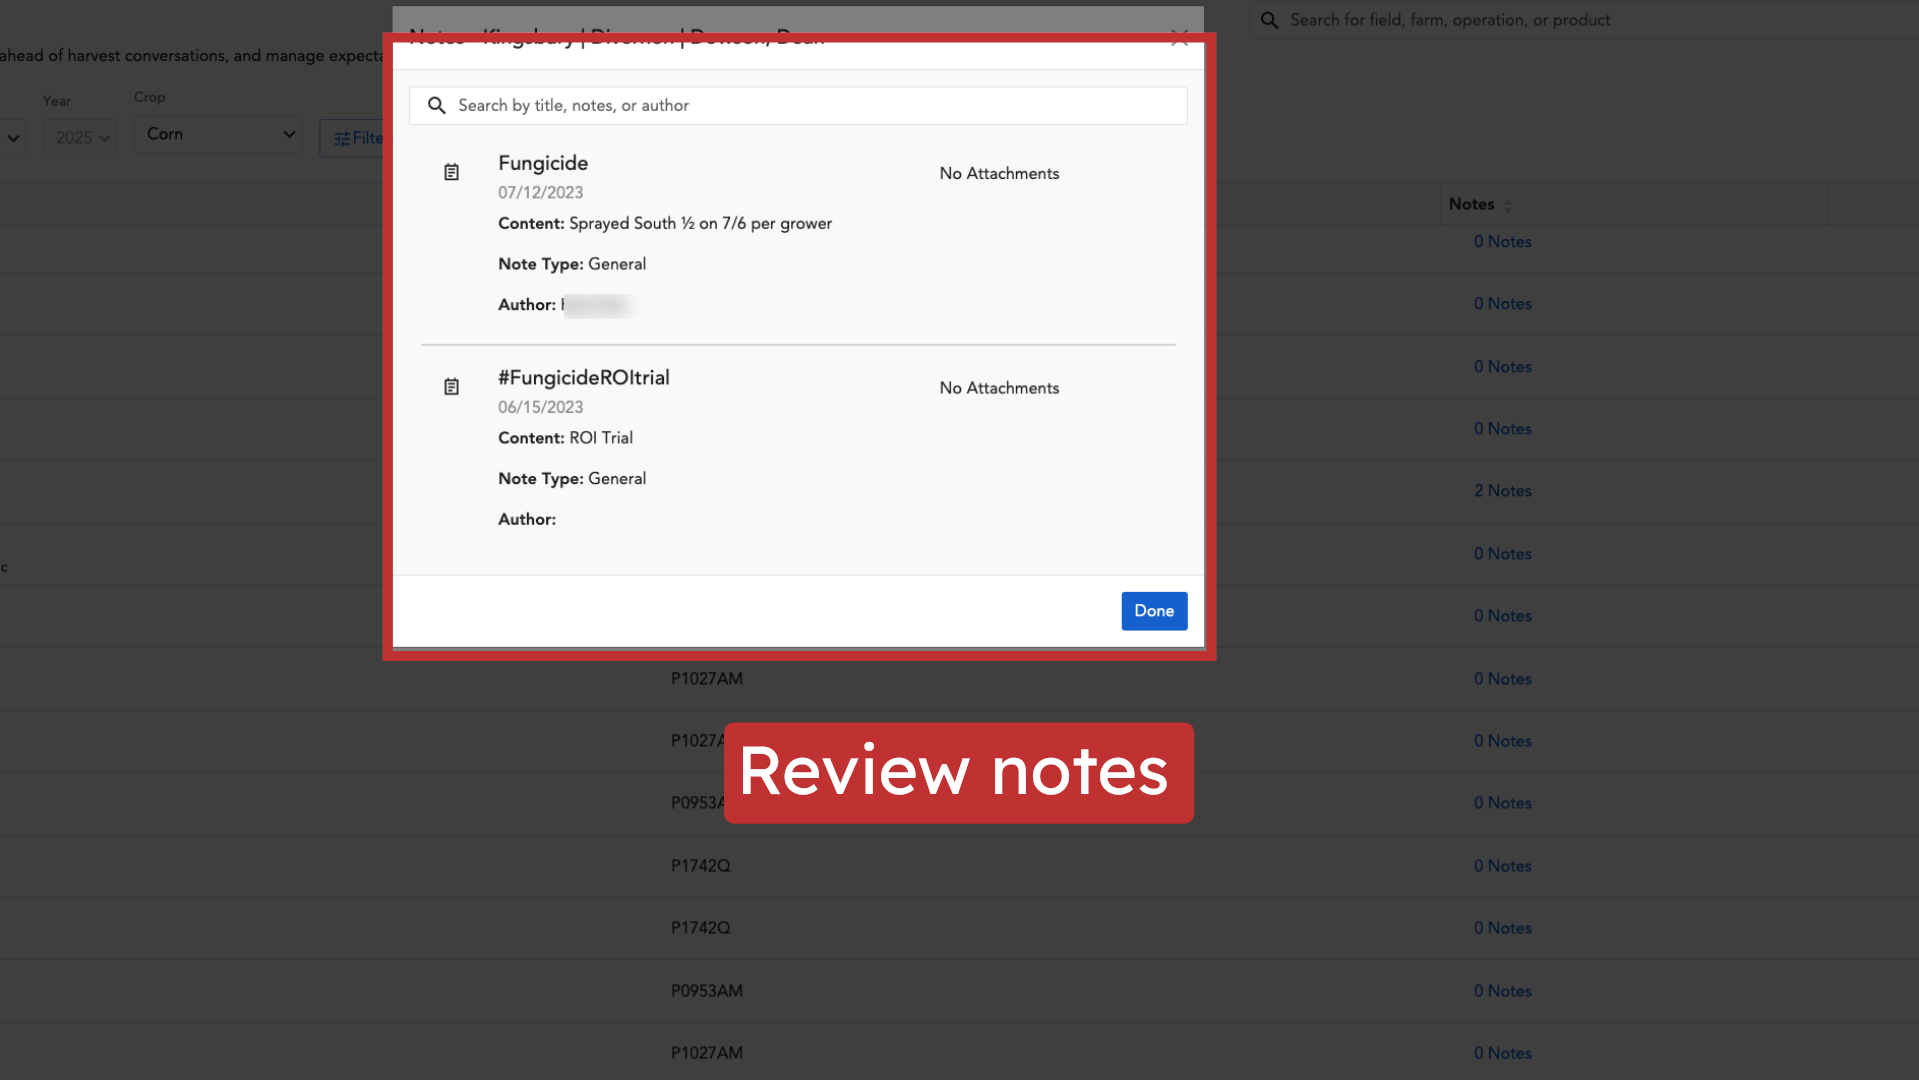
19. Review notes
Review any notes and photos that have been added to the field you're viewing to get more context on field conditions or observations.
In-Season Monitoring empowers you, as a Corteva seed sales rep, to move beyond basic weather discussions and lead informed conversations about performance impacts, positioning you as a trusted advisor. It helps you identify potential yield-limiting factors and proactively address them with your growers. Remember, In-Season Monitoring relies on accurate planting data (seed product and planting date). This data can be imported via machine data connections, uploaded planting files, or manual entry. If you need support, select the "Help" button within Granular Insights for articles, resources, or direct support via phone or email. We look forward to helping you achieve efficiency and product success.