Intro to Dashboard
In this video, you’ll learn how to use the Dashboard to quickly assess how the season is progressing, identify actionable insights, and prioritize where to focus your time across your agency.
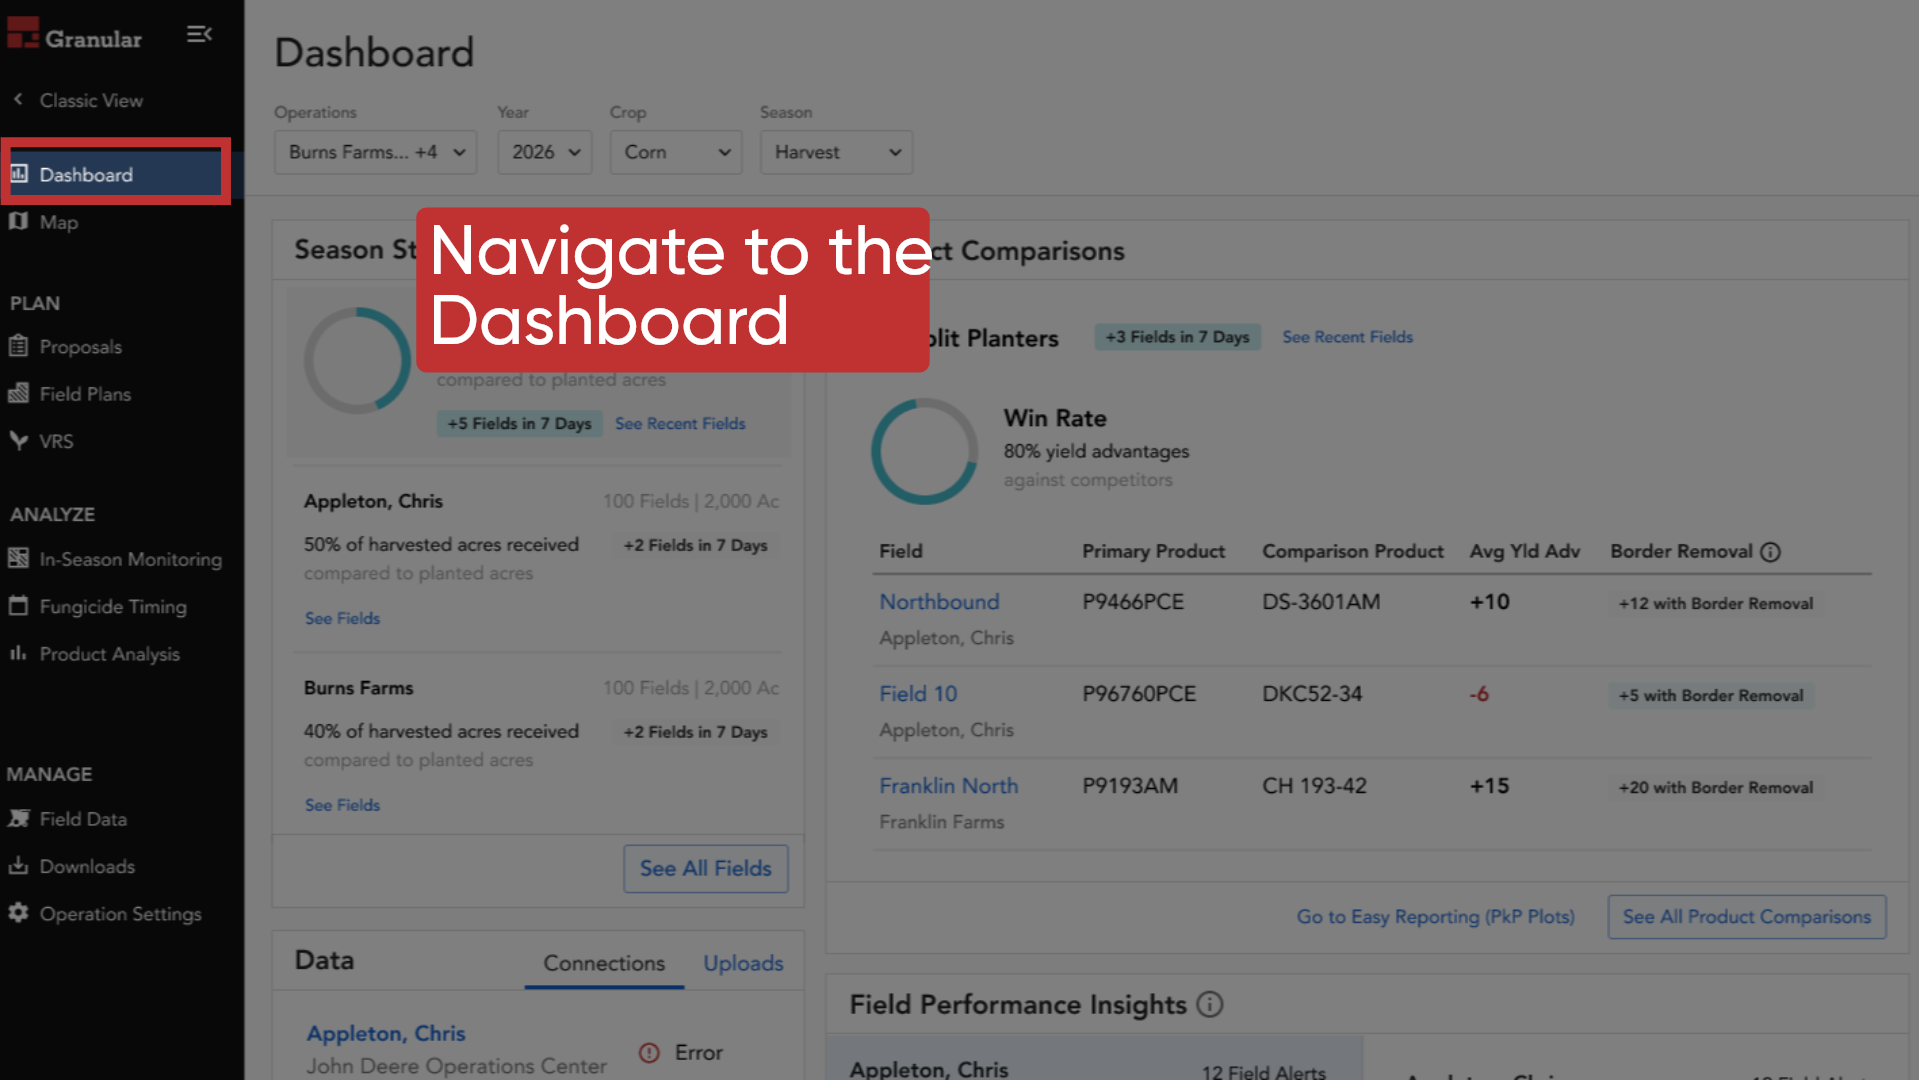
1. Navigate to Dashboard
To get started, log in and open the Dashboard to begin reviewing your operations.
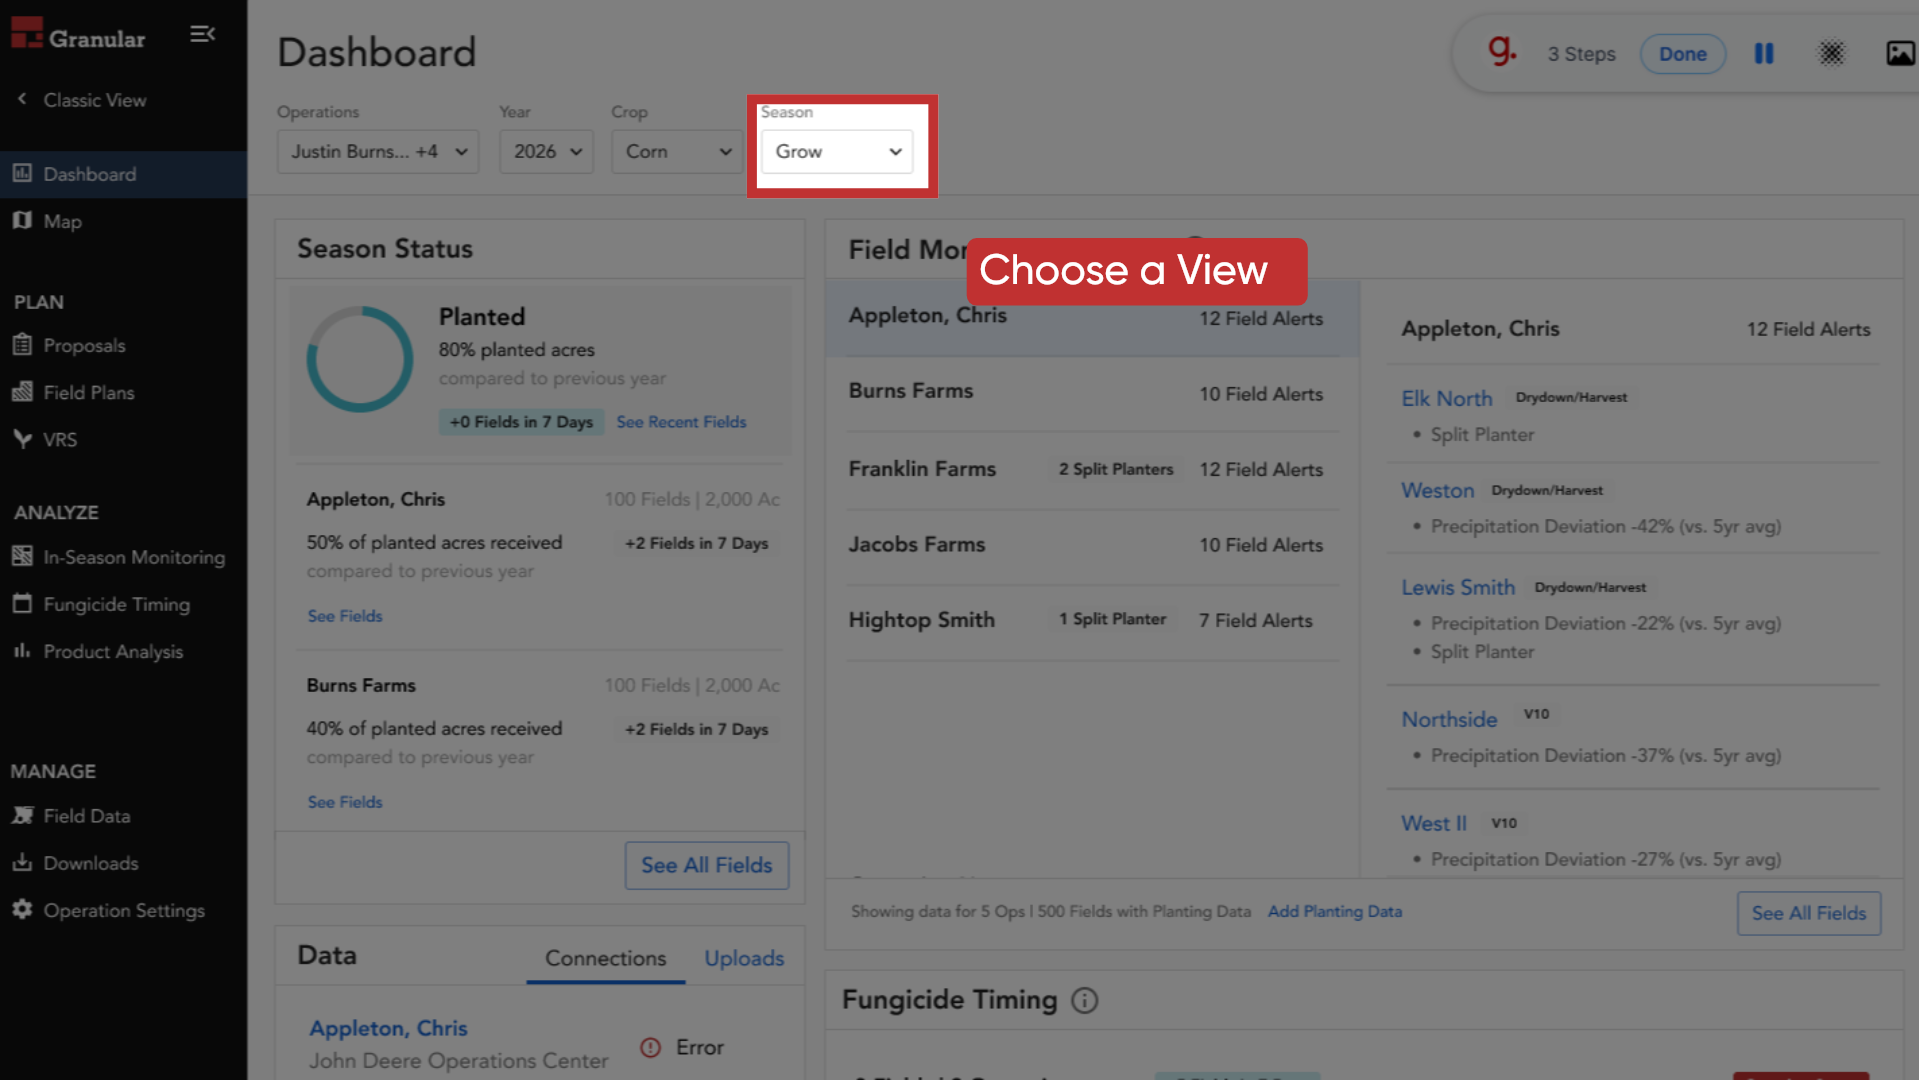
2. Choose your View
The Dashboard is separated into two views. There is a harvest view for end of season information, and a grow view for in-season information.
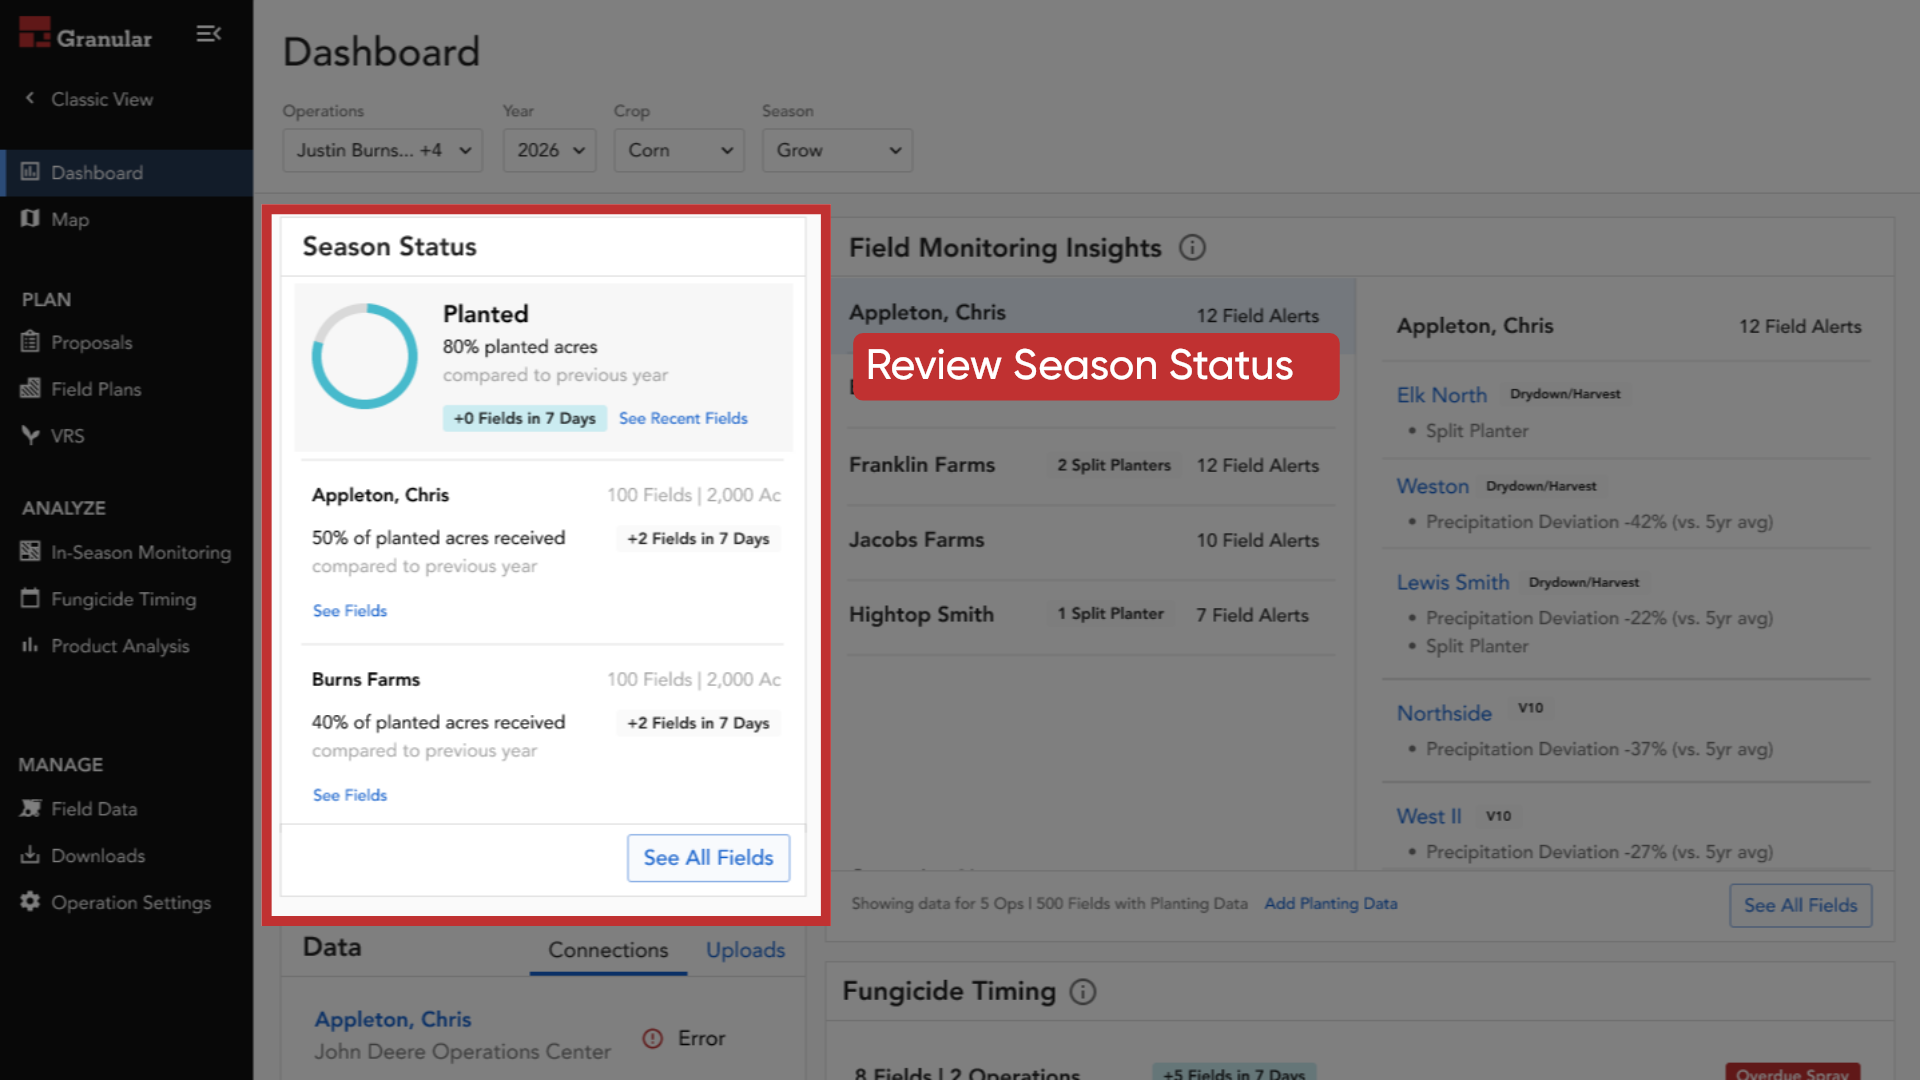
3. Review Season Status
Within the Grow section, you can review Season Status to track planting progress across operations so you know what, when, and where your customers are planting.
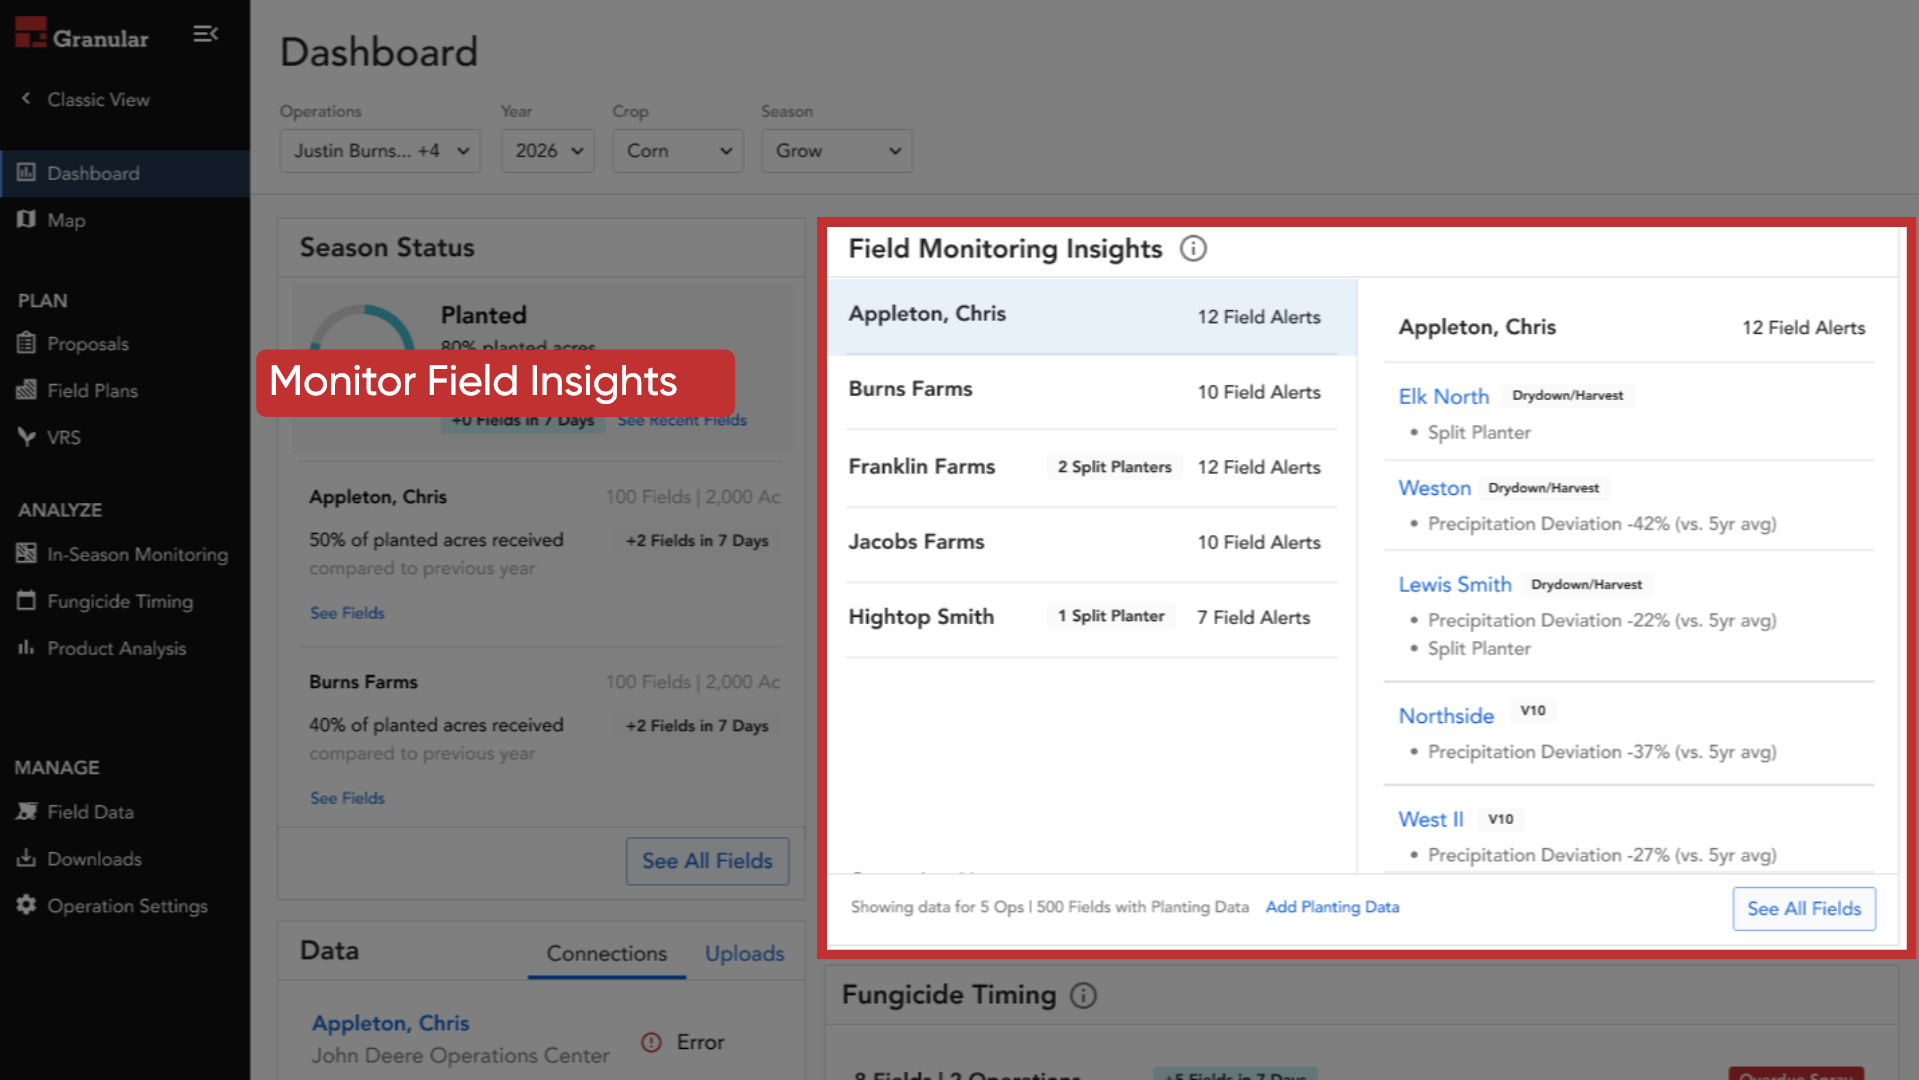
4. Monitor Field Insights
You can also use Field Monitoring Insights to monitor precipitation deviation, split planters, and growth stage so you can stay ahead of emerging threats.
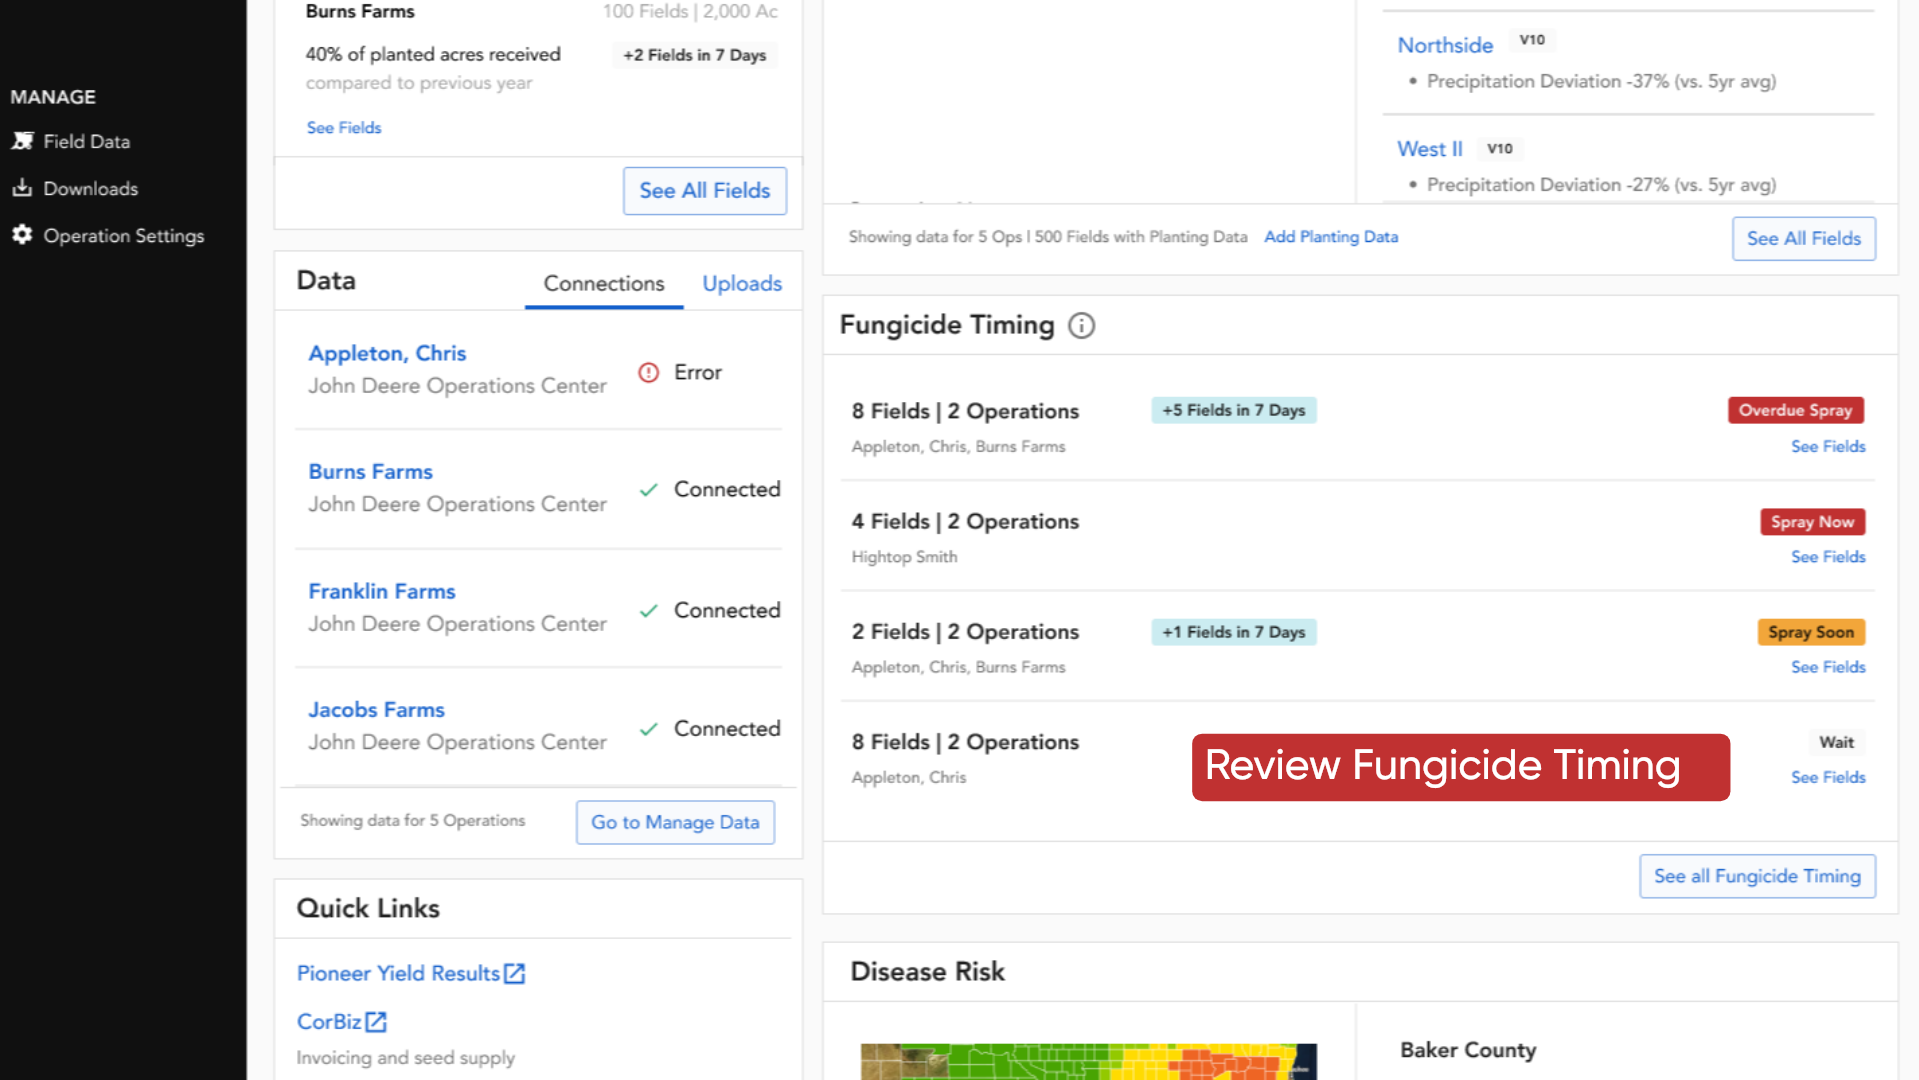
5. Review Fungicide Timing
The Fungicide Timing card allows you to view urgent application statuses and upcoming spray windows, helping you build confidence in your timing recommendations.
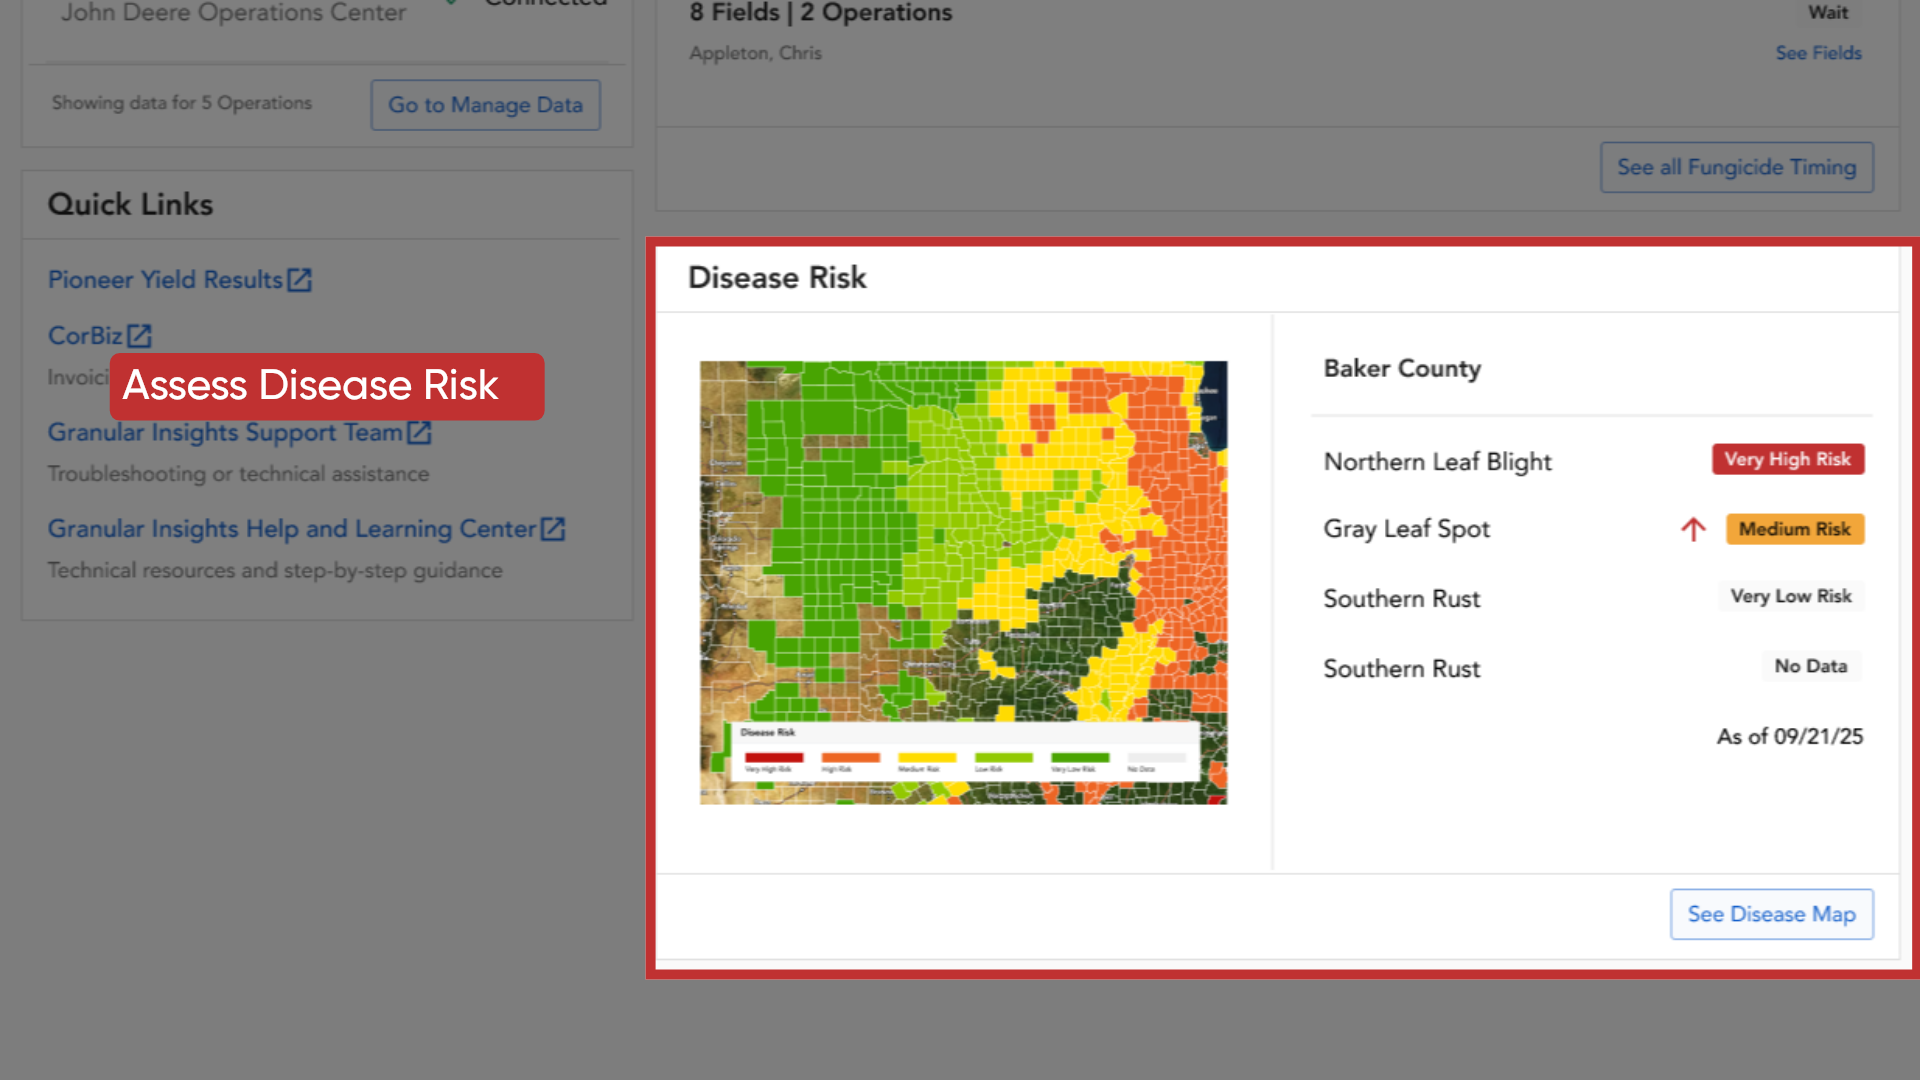
6. Assess Disease Risk
You can review Disease Risk to identify incoming threats and quickly prioritize the areas that need attention.
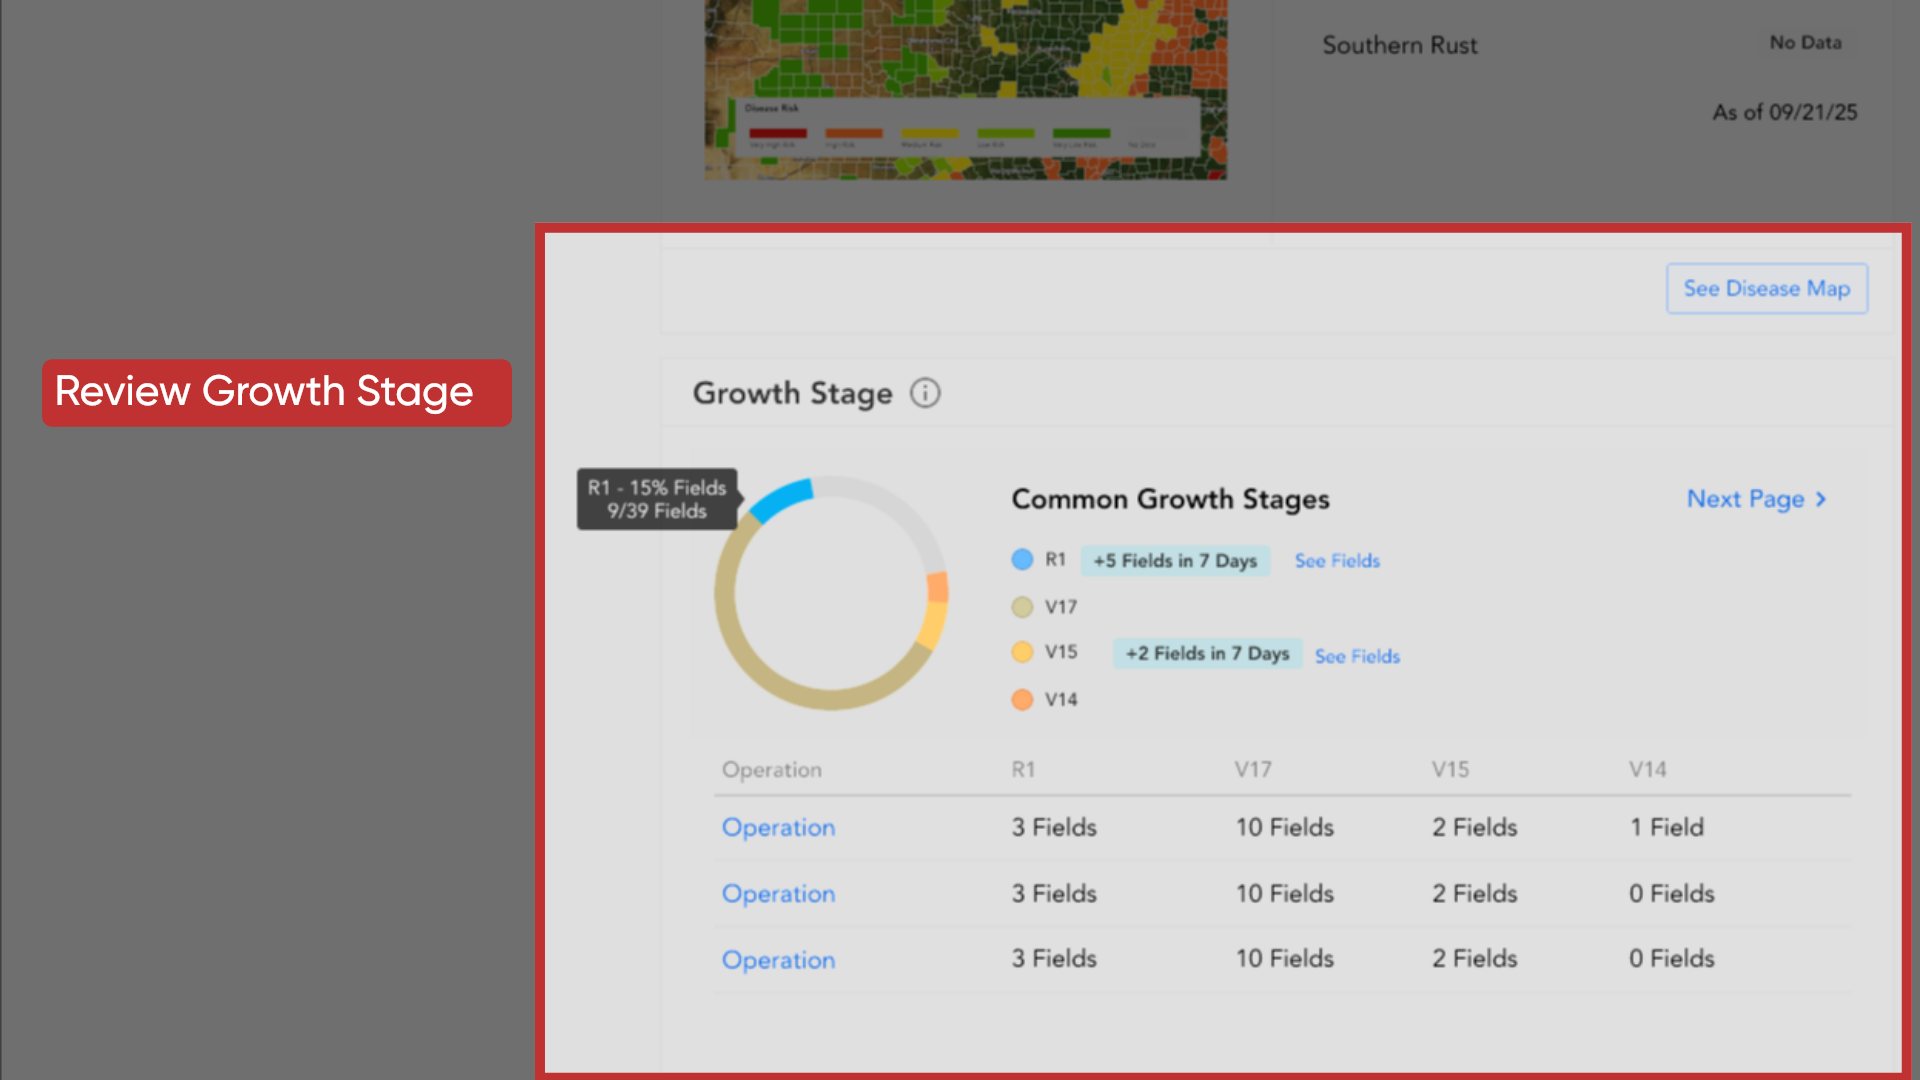
7. Review Growth Stages
The Growth Stage card helps you track field development across your agency so you can prioritize scouting efforts and focus on fields approaching important growth milestones.
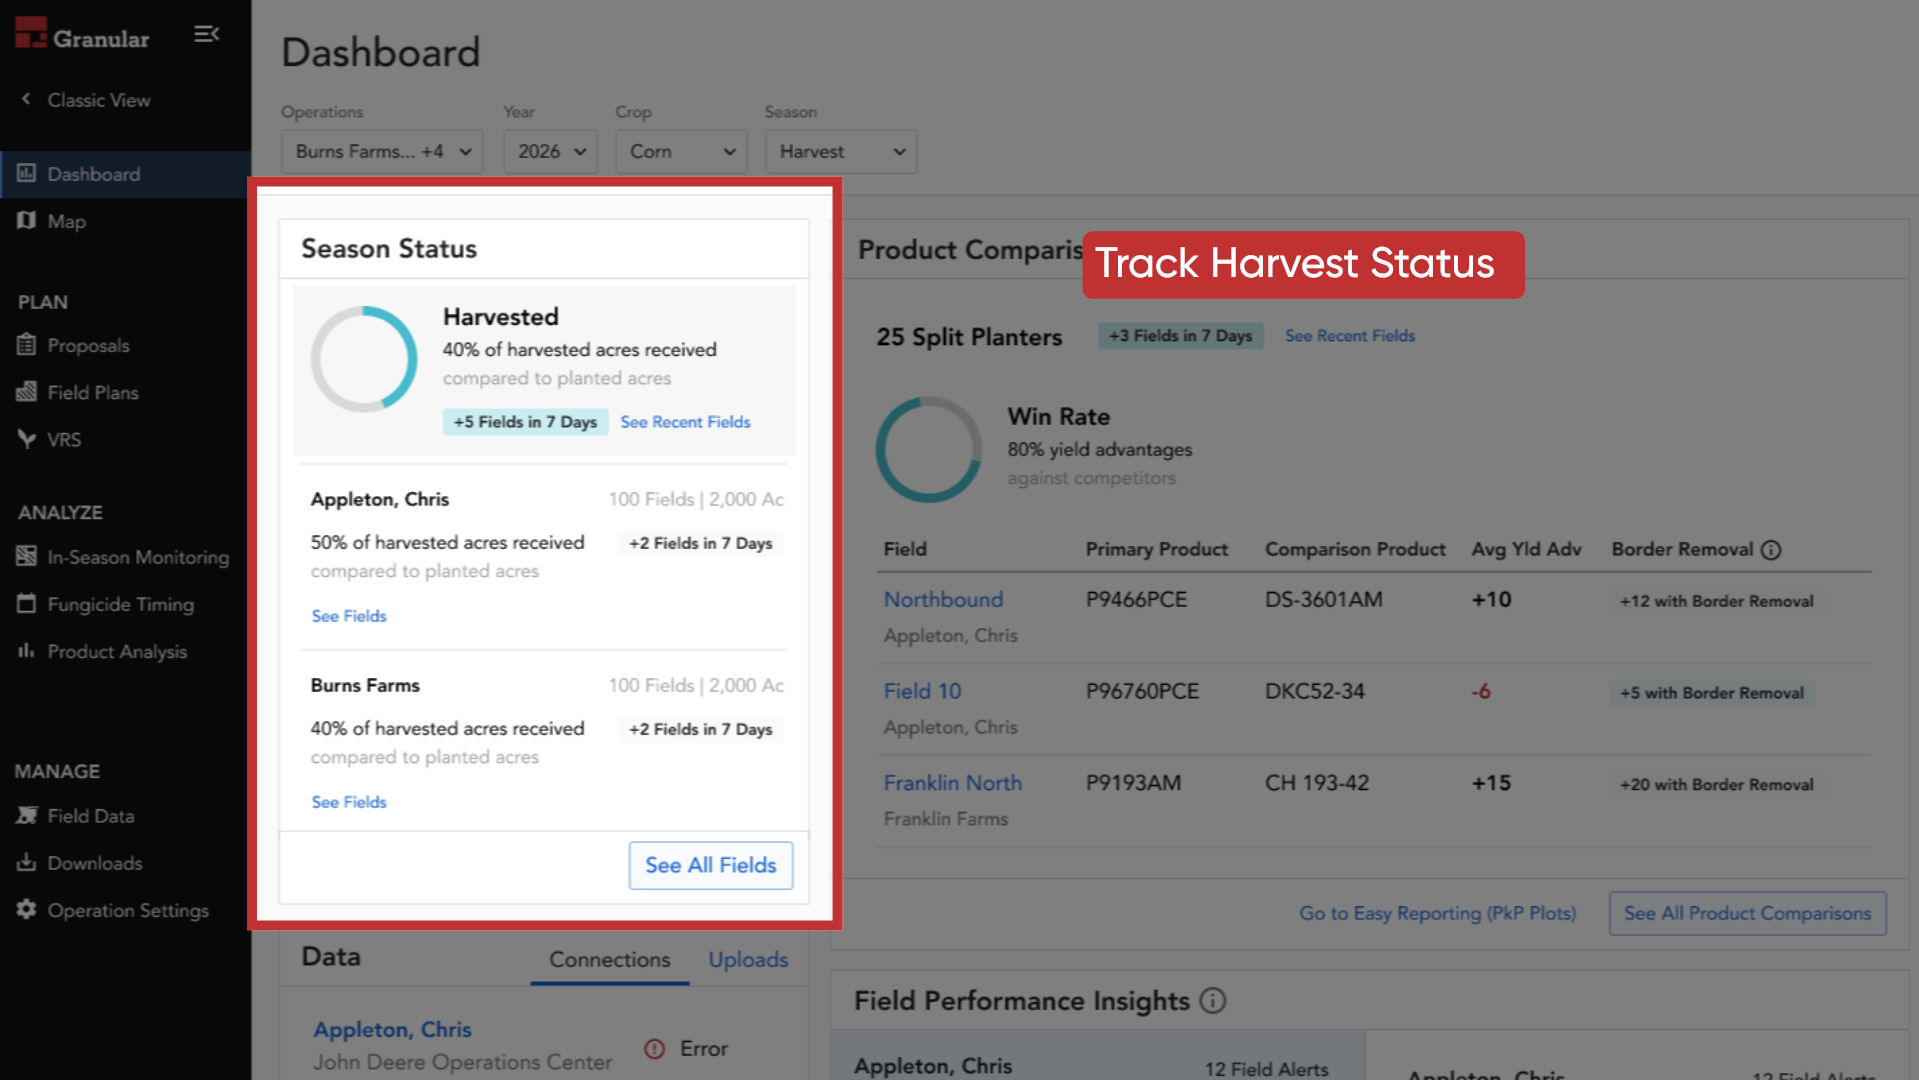
8. Track Harvest Status
Moving to the Harvest view, Season Status helps you track harvest progress and stay aligned with what your customers are seeing in the field.
9. Review Product Comparisons
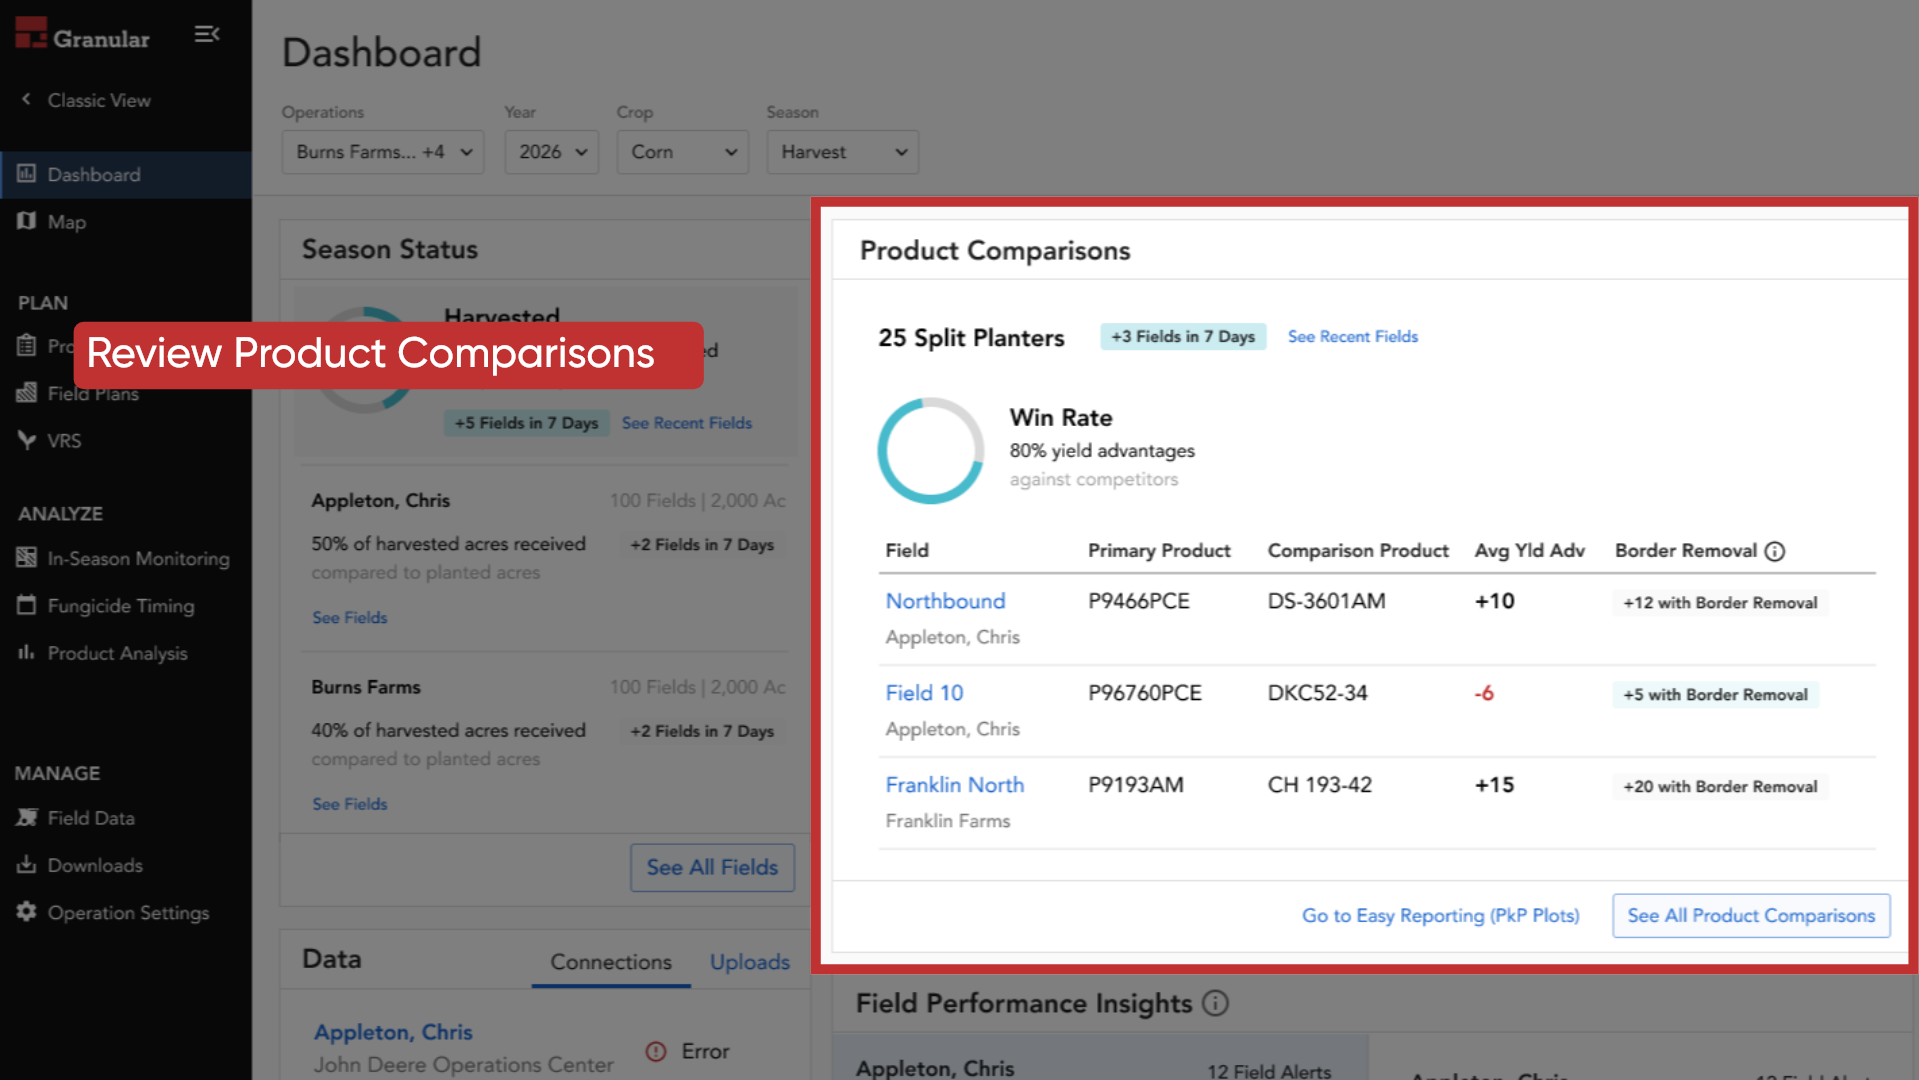
You can review Product Comparisons to evaluate split-planter results and quickly identify wins and losses, with border removal applied to help validate performance more accurately.
10. Identify Field Performance Issues
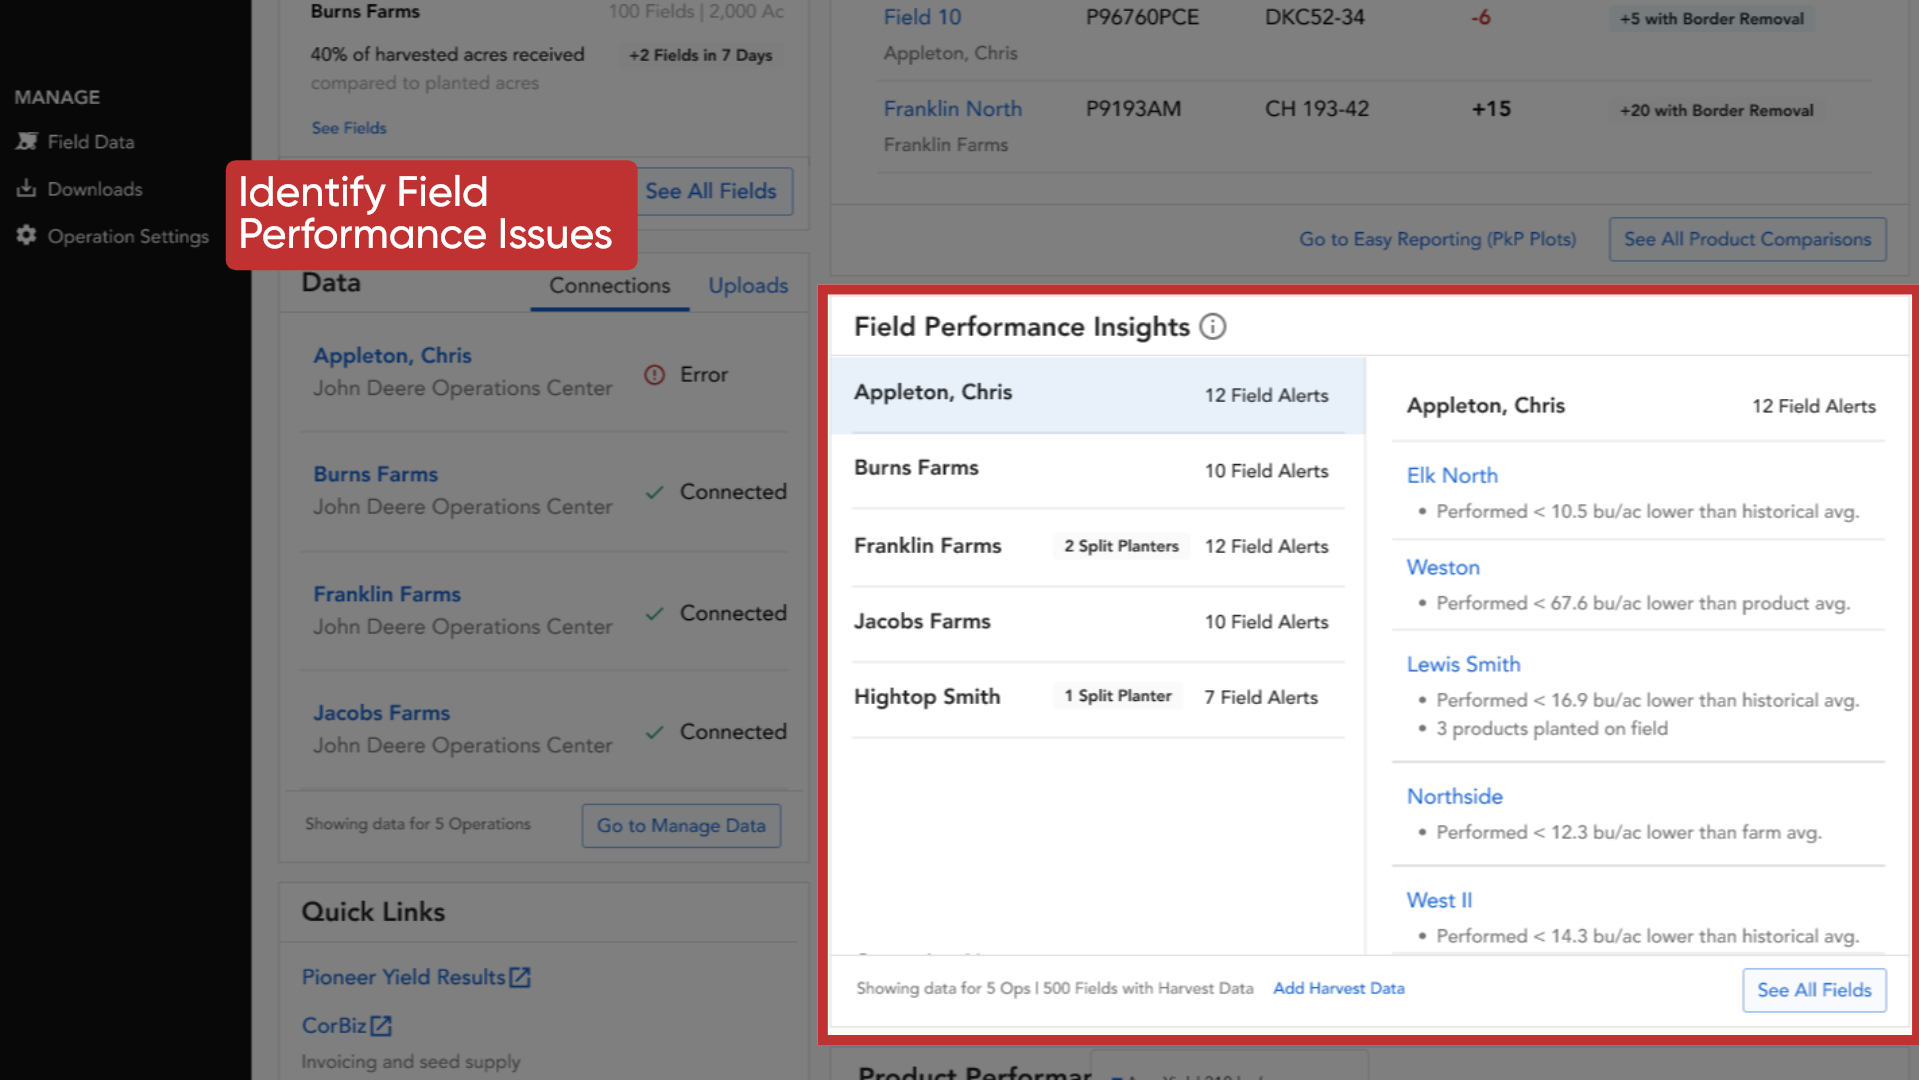
Field Performance Insights highlights performance trends from harvest data so you can quickly identify which fields need attention.
11. Evaluate Product Performance
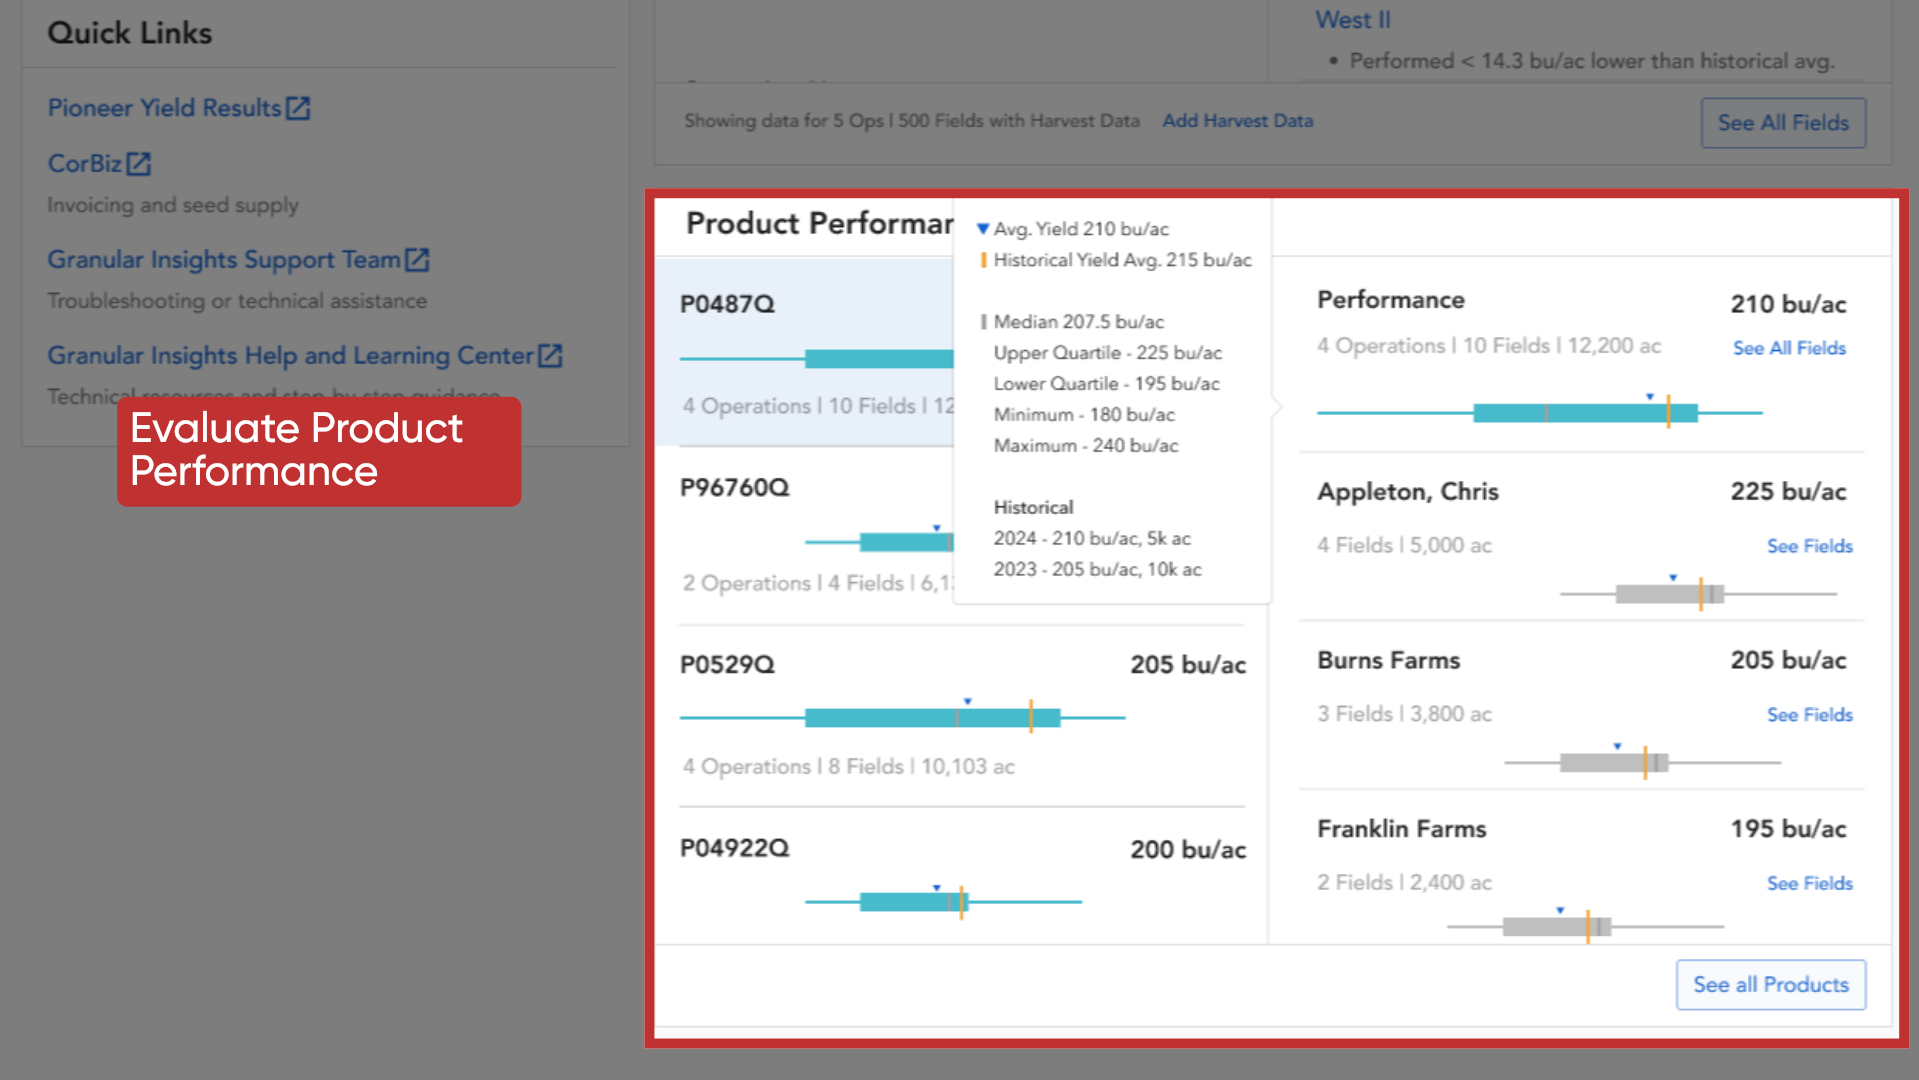
With Product Performance, you can compare how products are performing across your agency and identify both high and low-performing outliers. Use the box and whisker chart to understand consistency, and select the popover to view detailed metrics like minimum and maximum values.
Use the Dashboard regularly to stay ahead of the season, focus on what matters most, and make informed decisions across your operations.